| Index | Value | Change | A/D* | Trend | Trend Date | 20 Day Chart |
|---|---|---|---|---|---|---|
| Dow Jones | 38240 | 0.4% | 1/7 | down | 04/05/24 | 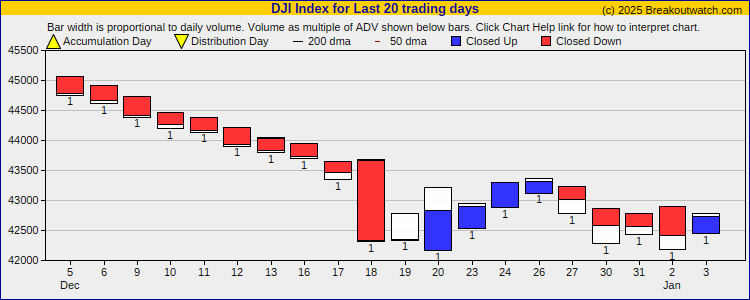 |
| NASDAQ Comp. | 15928 | 2.02% | 3/6 | down | 04/09/24 | 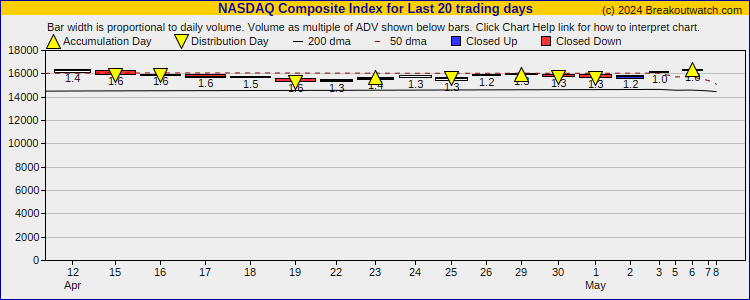 |
| S&P 500 | 5100 | 1.03% | 1/8 | down | 04/10/24 | 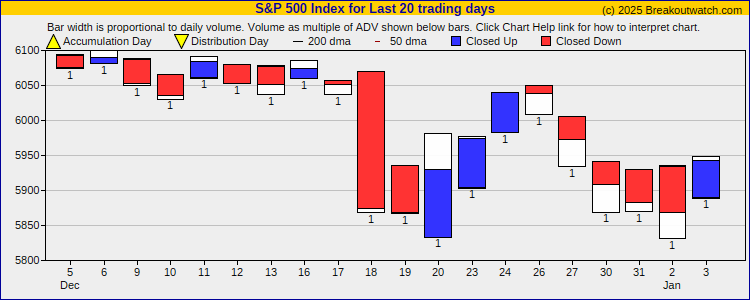 |
*Accumulation/Distribution Day count over
last 20 days
| Performance | 1 Week | 13 Weeks | 26 Weeks | Year-to-Date |
|---|---|---|---|---|
| Best Index | S&P 500 195.96 % |
S&P 500 209.79 % |
S&P 500 254.22 % |
S&P 500 214.71 % |
| 1 Day | 1 Week | 3 Weeks | 13 Weeks | |
| Industry | Networking & Communication Devices | Networking & Communication Devices | Furnishings | Networking & Communication Devices |
| Most Improved Industry | Silver + -1 |
Silver + -1 |
Silver + -1 |
Silver + -1 |
| No of breakout attempts: | 23 |
| No. of successful breakouts: | 15 |
| Symbol | Chart Pattern |
Gain above BoP |
Vol as % ADV |
Group |
Industry |
|---|---|---|---|---|---|
| GNK | CWH | 0.65 % | -0.13 % | Industrials | Marine Shipping |
| ALKT | SQZ | 1.33 % | 0.64 % | Technology | Software - Application |
| BAND | SQZ | 2.97 % | -0.11 % | Technology | Software - Infrastructure |
| BMA | SQZ | 0.92 % | -0.35 % | Financial Services | Banks - Regional |
| BPMC | SQZ | 3.84 % | 0.07 % | Healthcare | Biotechnology |
| GIII | SQZ | 0.43 % | -0.52 % | Consumer Cyclical | Apparel Manufacturing |
| GLP | SQZ | 0.13 % | -0.29 % | Technology | Information Technology Services |
| HCI | SQZ | 0.06 % | -0.08 % | Industrials | Waste Management |
| MAX | SQZ | 3.95 % | 0.33 % | Financial Services | Asset Management |
| NAMS | SQZ | 0.69 % | 0.3 % | Healthcare | Biotechnology |
| NEXA | SQZ | 1.23 % | -0.76 % | Financial Services | Banks - Regional |
| RACE | SQZ | 0.06 % | -0.57 % | Consumer Cyclical | Auto Manufacturers |
| SILK | SQZ | 3.65 % | 0.98 % | Healthcare | Medical Devices |
| SWTX | SQZ | 0.3 % | 0.16 % | Healthcare | Biotechnology |
| UVE | SQZ | 2.66 % | -0.12 % | Energy | Uranium |