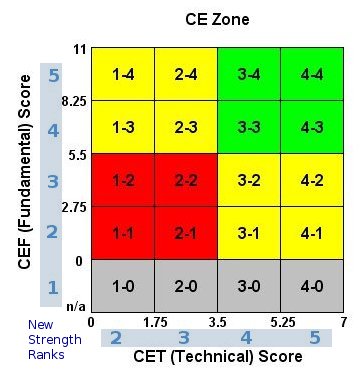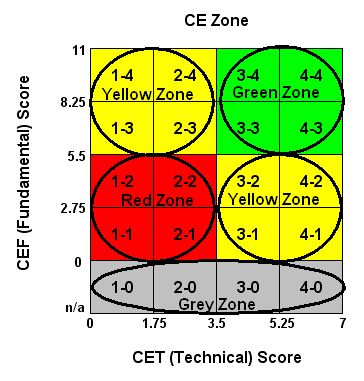
For example, a stock which has a CET score between 5.25 and 7 in combination with a CEF score between 8.25 and 11 will fall into the 4-4 CE Cell (This is the highest possible combination of CET and CEF scores). A stock which has a CET score between 0 and 1.75 in combination with a CEF score between 0 and 2.75 will fall into the 1-1 CE Cell. (This is the lowest possible combination of CET and CEF scores.)
In order to more easily identify whether a stock has the best combination of scores, we have denoted 4 major zones by color.

The Green CE Zone identifies those stocks that score in the top half of all possible CET and CEF scores, and so possess the best combination of desirable qualities in a CANTATA quality candidate.
Stocks in the Yellow CE Zones have either good fundamental or good technical scores, but not both. For example, a stock with good fundamentals but which has broken down technically would appear in the top left Yellow CE Zone. For example, a stock performing well technically but that does not possess the desirable fundamental characteristics for a CANTATA quality stock will appear in to the bottom right Yellow CE Zone.
Stocks in the Red CE Zone have a poor combination of both technicals and fundamentals and do not make the best current buy candidates for the intermediate term investor.
If you prefer to trade ETF's over individual equities, you will find these stocks in the Grey CE Zone. Stocks falling into CE Cells 3-0 and 4-0 have the best technical scores.
Our CE methodology is a scoring rather than a ranking system. Each stock is measured on its own merits independently from other stocks. As a result, we do not arbitrarily force a distribution of stocks across the CE Zone matrix. When the market is healthy, you will find more stocks in the right two columns of the matrix (Green CE Zone and lower right Yellow CE Zone). When the market is less healthy, more stocks will fall into the left two columns (upper left Yellow CE Zone and Red CE Zone). During times where the market is not favorable to growth stocks, you will find more stocks in the lower right Yellow CE Zone than in the Green CE Zone.
As stocks are selected for inclusion on our watchlists based on their technical patterns alone, they will appear on our watchlists regardless of their CE scores. That gives you as an investor a choice. You can either pursue a breakout on its technical merits alone or limit your purchases exclusively to growth stocks. We recommend you use the CE Zones as a means of narrowing your focus to growth stocks if you so desire. While the CE Zones are designed to help you more easily identify CANTATA quality candidates, it cannot substitute for appropriate due diligence.