| Chart Selector (CSSM) |
|
| Overview |
|
The Chart Selector can be used either as a supplementary mining tool
or as a means for determining whether a stock is currently setting up
in
a basing pattern matching your selection criteria.
|
| Entering Criteria |
Before setting criteria,
be sure to review the criteria used for selecting stocks for inclusion
on BreakoutWatchSM. This will ensure that you are not merely duplicating
the contents of the current Watchlist. To review the Watchlist methdology,
follow
this link.
|
| Criteria |
Description |
| Minimum RS |
Relative Strength
Ranking, the stock’s
weighted price appreciation over the prior year, as ranked against all
other stocks in our database. Resulting stocks will have RS >= value
entered. |
| Minimum Price |
The closing price on the most
recent date traded. By default, the price must also be no more than 5% below
the 200 day moving average. Resulting stocks will have Price >=
value entered. |
| Min. Avg. Volume |
The average daily
trading volume per day over the prior 50 trading days. Resulting stocks
will have Avg. Volume >= value entered. |
| Min. Cup Days |
The number of trading days between the
beginning of the cup with handle base (left cup date) and the beginning
of the handle (pivot point or B/O Price). Resulting stocks must have a
Left Cup with days in cup >=
value entered. |
| Max. Cup Days |
Resulting stocks must have a Left Cup
with days in cup <= value entered. |
| Min. Handle Days |
The number of trading days between the
beginning of the handle (pivot point or B/O Price) and the current date.
Resulting stocks must have a handle with days in handle >= value entered. |
| Max. Handle Days |
Resulting stocks must have a handle
with days in handle <= value entered. |
| Min. Setup Gain % |
Percentage rise from the Prior Low (lowest
intraday low prior to the Left Cup) to Left Cup.
Resulting stocks must have a setup gain >= value entered. |
| Max. Cup Depth % |
The difference between the left cup
price (highest intraday high which establishes the start of the cup) and
the base low price (lowest intraday low in the cup), expressed as a percentage
of the left cup price. Resulting stocks must have a cup depth >=
value entered. |
| Min. Pivot % |
The pivot point (B/O Price) divided
by the left cup (the beginning date of the cup with
handle base), expressed as a percentage. Values >100% indicate the pivot
is above the left cup. Values <100% indicate the
pivot is below the left cup. Resulting stocks must have
a pivot % >= value entered. |
| Max. Pivot % |
Resulting stocks must have a pivot %
<= value entered. |
| Min. Retracement % |
Percent of the Cup Depth the stock has
risen above the Base Low. For example, a stock which has fallen from Left
Cup = 100 to Base Low = 45 has corrected (100-45) = 55 points. A 38% retracement
requires that the stock recover 38% of the 55 points lost, or (0.38)*55
= 20.90 points. In this example, to meet the criteria, the Current Close
must be >= Base Low + retracement, or >= 45 + 20.90, or >= 65.90.
Note that if you set the midpoint criteria, it will effectively override
any retracement % criteria set to < 50%. Resulting stocks must have
a retracement >= value entered. |
| Max. Handle Depth % |
Difference between the Pivot and the
Handle Low, expressed as a percentage of the Pivot. By default, the handle
low must also be no more than 1% below the 200 day moving average. Resulting
stocks must have a handle depth <= value entered. |
| MidPoint Test |
The midpoint of the handle (price which
marks half the distance between the Left Cup and the Base Low) must be at
or above the midpoint of the base (price which marks half the distance
between the Pivot and the Handle Low). Check the box to apply the midpoint
test. Uncheck the box if you do not want to apply the midpoint test. |
| Stock |
Optional. Enter a symbol to test
whether a particular stock meets the criteria set above. |
| Cup:Handle Ratio |
This is set at <= 3 internally in the
algorithm and cannot be modified. |
| Using the CS for Supplementary
Mining |
Setting Criteria Example
1:

Setting Criteria Example 2: 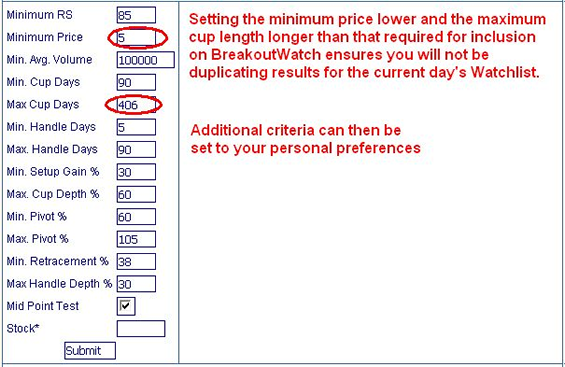
Sample Results:
For an overview of the columns in the resulting display, follow
this link. 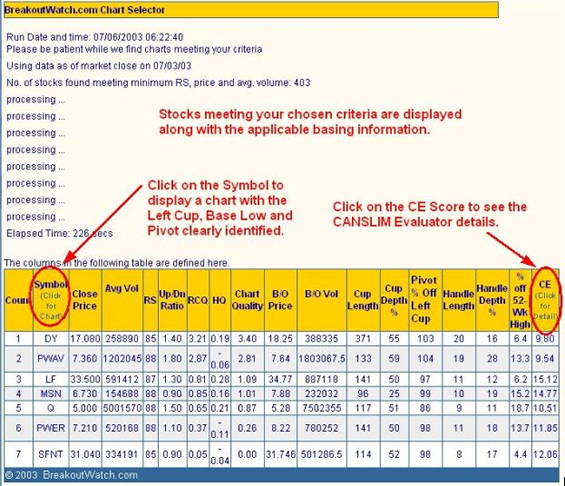
|
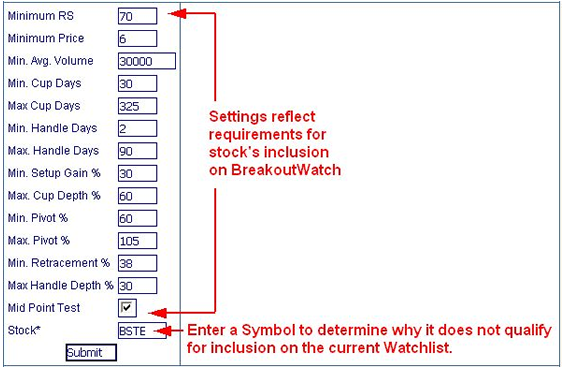
| Using the CS for Testing
a Specific Stock |
If you would like to
test a stock to determine why it did not make the current watchlist or
to determine whether it meets your desired criteria, enter criteria and
a symbol as in the following example:
If the stock does not meet the selected criteria, the resulting
diagnostics will state the reason.
If
the
stock
does meet
the crtieria,
the
stock will display as in the Sample Results above. 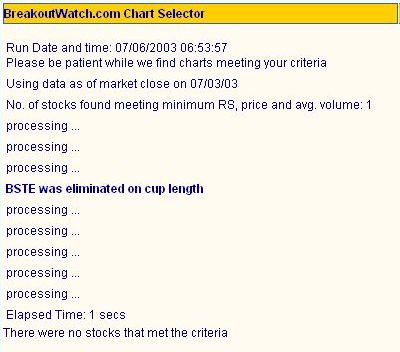
|