Our breakout trading history gives us over 20,000 (and growing) data points from which to identify the characteristics that make a quality breakout. An analysis of this data has led us to develop two recommended strategies: one for the individual investor who is able to monitor the markets in real time and can act quickly when a breakout occurs, and one for the individual investor who can only trade at the beginning or end of the day. Backtesting to 2004 shows these strategies gave excellent returns, even during the worst bear market since the 1930's.
(for individuals who can monitor the market in real time)
(for individuals who have limited daytime access to the markets)
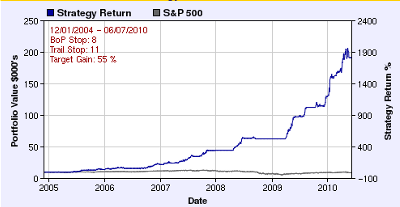
| Buy on Alert Results 12/01/2004 to 06/07/2010 | ||
|---|---|---|
| Number of Positions: 4; Buy Rule: Buy on Breakout Alert; Sell if Unconfirmed: no; Stop Loss: 8 %; Trailing Stop: 11 %; Max Hold Days: 20; Target Gain: 55 %; Use Market Trend: yes | ||
|
Strategy
|
S&P 500
|
|
| Initial Portfolio Value | $10,000.00 | $10,000.00 |
| Final Portfolio Value | $191,388.91 | $8,817.33 |
| Profit % | 1813.89 % | -11.83 % |
| Avg. premium paid over breakout price | 0 % | N/A |
| Maximum Portfolio Value | $205,890.48 | $3,137.40 |
| Maximum Gain % | 1958.9 % | 31.37 % |
| Compound Annual Return % | 117.2 % | -3.25 % |
| Minimum Portfolio Value | $9,958.84 | $5,678.59 |
| Minimum Portfolio Value % | -0.41 % | -43.21 % |
| Maximum Drawdown | $15,330.83 | $7,458.81 |
| Maximum Drawdown % | 7.45 % | 56.78 % |
| Risk Adjusted Return | 243.48 |
-0.21 |
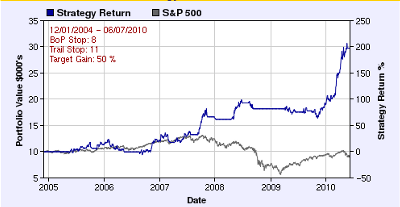
| Buy on Confirmed Breakout Results 12/01/2004 to 06/07/2010 | ||
|---|---|---|
| Number of Positions: 4; Buy Rule: Buy on Confirmed Breakout; Sell if Unconfirmed: no; Stop Loss: 8 %; Trailing Stop: 11 %; Max Hold Days: 30; Target Gain: 50 %; Use Market Trend: yes | ||
|
Strategy
|
S&P 500
|
|
| Initial Portfolio Value | $10,000.00 | $10,000.00 |
| Final Portfolio Value | $29,762.97 | $8,817.33 |
| Profit % | 197.63 % | -11.83 % |
| Avg. premium paid over breakout price | 2.33 % | N/A |
| Maximum Portfolio Value | $30,726.65 | $3,137.40 |
| Maximum Gain % | 207.27 % | 31.37 % |
| Compound Annual Return % | 33.19 % | -3.25 % |
| Minimum Portfolio Value | $9,521.48 | $5,678.59 |
| Minimum Portfolio Value % | -4.79 % | -43.21 % |
| Maximum Drawdown | $3,536.98 | $7,458.81 |
| Maximum Drawdown % | 17.79 % | 56.78 % |
| Risk Adjusted Return | 11.11 |
-0.21 |