The 'Expected Gain' is the statistical expectation of the percentage gain over the breakout price that a stock could achieve if it breaks out from a Cup-with-Handle chart pattern. The Expected Gain is only statistically valid if a stock breaks out. It says nothing about the probability that a stock will break out.
There are two points at which we estimate expected gain. First, when placing a stock on the watchlist and second on the day the stock breaks out. The significant difference between the two is that on the day the stock breaks out we can use the breakout volume to improve the estimate, although as we will see, only slightly.
The 'Expected Gain' is derived from a statistical model based on the performance of all stocks that broke out between April 1, 2003 and September 3, 2004.
Methodology
There were 1324 stocks that broke out from our BreakoutWatch Cup-with-Handle chart pattern between April 1, and September 3, 2004. Our database holds all the technical and fundamental information that we publish about those stocks and we have conducted an analysis of which factors contribute meaningfully to the maximum percentage gain since breakout of the stocks.
We sought to build an equation where the maximum gain since breakout (max_gain) was the dependant variable and the dependant variables were breakout price, breakout volume, pivot depth, cup depth, cup length, handle depth, handle length, right cup quality (rcq), handle quality (hq), chart quality (cq) breakout date, CET1, CET2, CET3, CET4, CET5, CEF1, CEF2, CEF3, CEF4, CEF5, CEF6, CEF7, CEF8, CEF9, CEF10, CEF11 and industry_rank.
 We
first looked at the range of maximum gains that were achieved. These
ranged up to 1158%, but the vast majority were 250% or less (see histogram
at right). We therefore excluded from analysis cases where the the max_gain
was more than 250 since it is unreasonable to expect any model to be able
to forecast such abnormal gains.
 We
next looked at scatter plots of the dependant variable against each of
the independant variables.
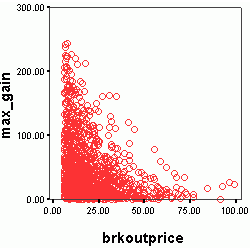
For example, look at the scatter plot of max_gain against breakout price.
Firstly, note that the lowest breakout price is $6.00. This is because
we pre-filter our watchlist for stocks with a minimum price of $6.00.
Secondly, note that there appears to be an inverse relationship between max_gain and breakout price. This suggests that we should look for a relationship between max_gain and 1/brkoutprice.
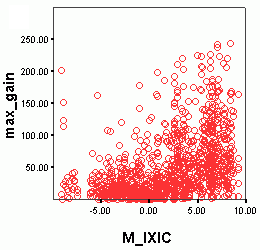
 We would also expect a
relationship between the maximum gain achieved after breakout and the market
condition at the time of breakout. This is in fact the case as shown by
a plot of max_gain against our 'M' value for the NASDAQ (IXIC).
We would also expect a
relationship between the maximum gain achieved after breakout and the market
condition at the time of breakout. This is in fact the case as shown by
a plot of max_gain against our 'M' value for the NASDAQ (IXIC).The result was two models: one that we use when estimating the expected gain before breakout (pre-breakout model) and the second that we use to estimate the expected gain on the day of breakout (post breakout model).
The pre-breakout model explains 64% of the observed variations in maximum gain with a standard error of 39%.
The post breakout model explains 65% of the observed variations in maximum gain with a standard error of 38%.
Expected Gain provides us with a new metric to use when selecting stocks for purchase. Theoretically, a stock with a higher expected gain will outperform a stock with a lower expected gain. However, because of the size of the standard error of the estimate this is more likely to be true when the difference in expected gain between the two stocks is greater than the standard error. Consider the case where three stocks break out on the same day:
Stock A: Expected gain 20%
Stock B: Expected gain 30%
Stock C: Expected Gain 70%
Stocks A and B are effectively equivalent because their Expected Gains are well within the standard error of each other. Also, stocks A and B are not significantly different from 0% gain, so we can consider them to have low likelihood of achieving a significant return.
Stock C, however, has an expected gain significantly better than either stock A or B and is more likely to provide a significant gain.
Remember, however, that the model only explains 64% of the observed range of maximum gains so our expectation that stock C will outperform stocks A and B is only likely to be correct 64% of the time (that is, approximately 2 times out of three). The model may never be exactly accurate for any particular stock, but overall, consistent use of the model to make purchase decisions should bias returns in the investor's favor.
Our expected gain model was built over a period of 17 months using 1324 breakouts. While 1324 is a good sample size, the period is small compared to the length of typical market cycles and past performance is no guarantee of future gains.
Remember also that there are many external factors that affect the maximum gain potential of a stock, both before and after the stock breaks out, that the models cannot take into account.