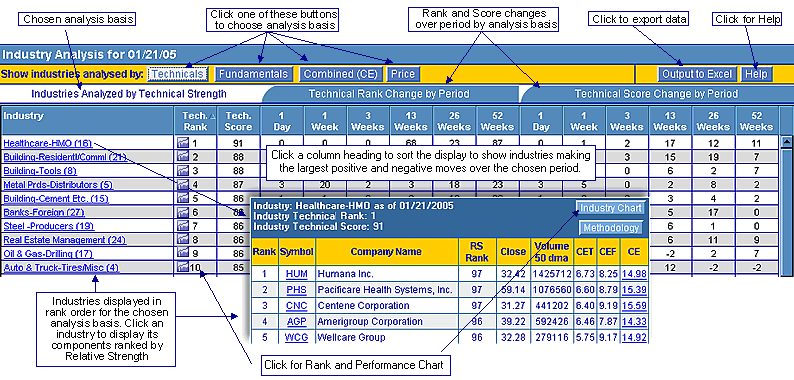
The purpose of Industry Analysis is to identify leading industries and leading stocks within those industries. Our Industry Analysis screen allows the analysis of industry performance over the last 12 months on four (4) different bases:
- by Technical strength
- by Fundamental Strength
- by Combined Technical and and Fundamental Strength
- by Price Strength only (compares today's price to change over 3 and 6 months).
For each of the four different bases, we provide a unique set of statistics allowing you to understand how industries are performing relative to their past performance and relative to the performance of other industries;:
- Industry Rank based on each of the four measurement bases - this shows industry performance relative to other industries
- Industry Score used to develop the rankings. Changes in the score show how an industry is performing relative to its past performance
- changes in Rank and Score over 1 day, 1 week, 3week, 13 week, 26 week and 52 week time periods. This shows clearly which industries are moving up, or moving down, over time.
For each industry, you are just a click away from seeing all stocks in the industry, ordered by relative strength, and from there to a chart of the industry showing rank, price performance and volume for the last twelve months. This graphic summarises how to use the display.

Fundamental data is updated weekly during the the daily update following the first trading session of the week, usually Monday.
Technical and Price data is updated daily.
Consequently, the Technical, Combined and Price analysis screens change daily, while the Fundamental screen changes weekly.
Restrictions apply to Silver subscribers - see below.
Silver subscribers have access to the technical and price data as it was at the last weekly update.
Trial, Gold and Platinum subscribers have access to the most recently available technical and price data.
Guest subscribers can see the data as it was 1 month ago.
Only Trial and Platinum subscribers can download the data.
Technical analysis results are updated daily.
We measure the core technical condition of each stock in the industry. This consists of the stock's current price relative to its 50 day moving average (dMA), the stock's current price relative to its 200dMA, the stock's 50 vs 200 dMA, the stock's price relative to its 52 week high, and the stock's RS Rank. These core technical scores are then averaged across all stocks in the industry to derive an average core technical score for the industry. We then normalize this underlying value and assign an Industry Technical Score from 1 to 100. Each industry is scored independently from another. An industry in which all stocks' prices are above both their 50 dMA and 200 dMA's, the 50 dMA's are above the 200 dMA's, the prices are each within 15% of the 52 week high and RSRanks all equal 99 will receive the highest possible Industry Score of 100. An industry in which all stocks' prices are below both their 50 and 200 dMA's, the 50 dMA's are below the 200dMA's, the prices are more than 60% off the 52 week high and RSRanks all equal 1 will receive the lowest possible Industry Score of 1.
In order to assign an Industry Rank, we sort the industries on their underlying average core technical scores from best to worst. We then assign a rank from 1 to 215 (best to worst).
Fundamental analysis results are updated weekly on after the first trading session of the week.
We measure the fundamental strength of each stock in the industry using our CEF metric. These fundamental scores are averaged across all stocks in the industry to derive an average fundamnetalscore for the industry. We then normalize this underlying value and assign an Industry Fundamental Score from 1 to 100. Each industry is scored independently from another.
In order to assign an Industry Fundamental Rank, we sort the industries on their underlying average fundamental scores from best to worst. We then assign a rank from 1 to 215 (best to worst).
The combined results are updated daily using the most recent technical information and the weekly fundamental information.
We measure the combined strength of each stock in the industry using our CANTATA Evaluator (CE) metric. The CE scores are averaged across all stocks in the industry to derive an average CE score for the industry. We then normalize this underlying value and assign an Industry Combined Score from 1 to 100. Each industry is scored independently from another.
In order to assign an Industry Combined (CE) Rank, we sort the industries on their underlying average CE scores from best to worst. We then assign a rank from 1 to 215 (best to worst).
The price analysis is updated daily.
The price analysis compares the average price of all stocks in an industry to the average price as it was 3 and 6 months ago. The 3 month comparison is given a weight of 0.7 and the 6 month comparison a weight of 0.3. The resulting raw score is then used to rank the industries best to worst from 1 to 215. Because there is no theoretically perfect raw score under this method of scoring, a normalized score is assigned in which the top raw score is assigned a value of 99 and the worst a value of 1. Normalized scores are then assigned to the other industries on the basis of the relationship of their raw score to the best raw score.