It is common wisdom that most stocks move in the same direction as the "market". The wise investor therefore tries to use the market direction as a guide as to when to be invested and when to be on the sidelines, or short. The problem is that the "market" is not a monolithic animal and within the market different kinds of stocks move with different responses to economic conditions. One way to deal with this is through analyzing the market by industry group which we cover in our industry analysis service. Another method is to track the market using indexes that are designed to reflect the strength and weakness of different kinds of stocks.
We choose to follow five indexes that reflect different aspects of the market:
- The Dow Jones Industrials (DJI) is a price weighted index that tracks 30 large cap stocks representative of the overall US economy.
- The S&P 500 (SPX) is a market capitalization (share price times the number of outstanding shares) weighted index of the largest 500 US stocks traded on the NYSE and NASDAQ exchanges
- The NASDAQ Composite Index (IXIC) is a market capitalization weighted index of over 3000 stocks and ADR's that trade on the NASDAQ exchange. Because it includes foreign stocks it is not exclusively representative of the US market. The NASDAQ Composite is considered the most representative index of growth stock and tech. stock performance.
- The Russell 2000 (RUT) is a market capitalization weighted index of the smaller 2000 companies in the Russell 3000.
- The Wilshire 5000 (DWC) is a market capitalization weighted index of the market value of all stocks actively traded in the USA. As such, it represent the overall market performance.
For each of these indexes we have developed a model that determines the current trend of the index in question. We report this trend as "up" or "down" on our Market Analysis page each day. If one is invested only when the trend is "up" then one expects that the overall return over an extended period of time will be higher than if one were to "buy and hold" for the same period.
The charts below show the model applied to the five indexes since 1990 (DWC since October 2000). The charts show that by being invested in the index only during a model identified 'up' trend substantially better performance can be obtained than if one simply buys and holds the index. Note though that because there is always a lag between the true start of a trend and the time that the model recognizes the trend is confirmed, it is always possible to lose in the short term and gains are only made through persistent application of the model.
The charts show the daily index value against the left axis and the effective gain in the index while in a model identified 'up' trend on the right. The vertical gray zones show the periods when the index was in a down trend.
Let's consider the Dow Jones chart to understand what the charts represent. Beginning in 1990, the model first recognizes an up trend on 6/18/90 when the index is at 2882 but then recognizes the trend has turned downward on 8/30/90 when the index has fallen to 2593. The first red line segment on the chart shows the loss and the right axis shows the effective gain was negative. The model then detects an upward trend has begun again in March 1991 and this continues until March 28, 2001. This is shown by the second red line segment and the right axis shows the effective gain has gone from -289 to +6557. After a brief period out of the market, the model recognizes an up trand but later reverses for a small loss (third red line segment). The model then keeps us out of the market until August 2003 and keeps us invested until June 17, 2008. From January, 1990 to 10/28/08 the index had gained 223% while the cumulative effect of our gains and losses gave us a gain of 309% from June 18, 1990 to June 17, 2008.
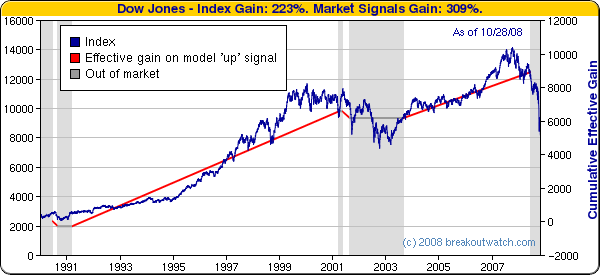
The DJI is the least volatile index and the market trend model is consequently very conservative about when to call a change in trend. Nevertheless, note that the model would have kept an investor in cash during most of the 2001-2003 recession and since June 2008.
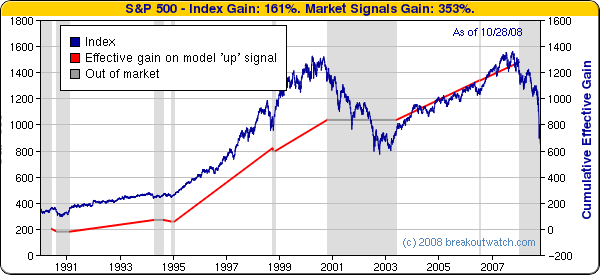
The trend model is more successful with the S&P 500 keeping an investor out of the market during the whole of the 2001-2003 recession and since January this year.
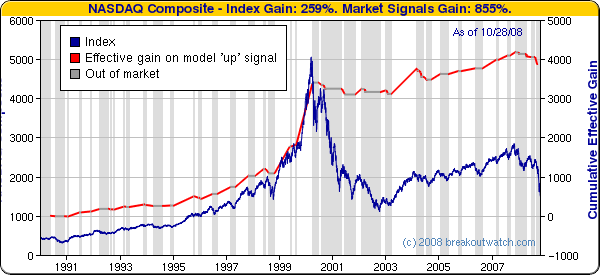
The trend model when applied to the NASDAQ allowed an investor to keep most of the dot com bubble gains.
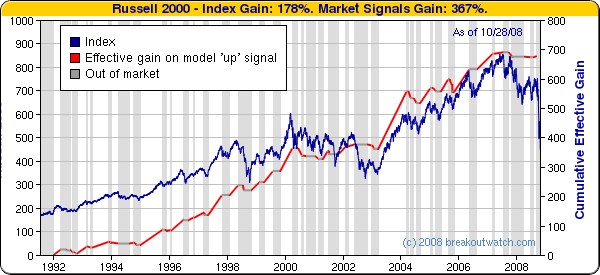
The high volatility of the Russell 2000 causes frequent trend shifts but the model accurately selects the up trends with very few losing periods.
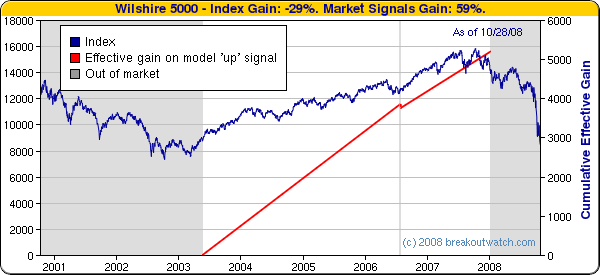
The DWC data does not go back before October 2000. The trend model is very conservative about the overall market and does not detect an upward trend until May 2003. Using this model an investor would have been mostly invested from then until January of 2008.