| Market Summary | Weekly Breakout Report | Top Breakout Choices | Top 2nd Chances | New Features | Tip of the Week |
| Index | Value | Change Week | Change YTD | Market1 Signal |
Commentary | |||||||||||||||||||||||||||||||
|---|---|---|---|---|---|---|---|---|---|---|---|---|---|---|---|---|---|---|---|---|---|---|---|---|---|---|---|---|---|---|---|---|---|---|---|---|
| Dow | 10539 | 1.46% | 1.24% | enter | The market rally continued for the third straight week Although gains were below last weeks exceptional performance, they were still very healthy. The NASDAQ was easily the strongest performer with a gain of 2.3%. The NASDAQ also scored two accumulation days this week while the other two indexes managed 1. These gains and the industry action (see below) shows that the NASDAQ market is where we can expect to see the most gains for breakout stocks in the near term. The number of confirmed breakouts this week was again over 10% higher than the average over the last 13 weeks, confirming that we are in a bullish time for breakouts. Less than last week, but last week was exceptional, and the average gain for the week was less also for the same reason. Breakout performance was very strong. We issued an alert for CKCM on Monday that went on to reach an intra-day gain of 32% before settling back to a 25% gain for the week. PRVD made an intra-day gain of 27% before closing the week only just off its high. The average gain for the week was 6%. Not bad on an annual basis! For an analysis of one of these 'average' performers, see our weekly tip below. The industries producing the most breakouts were Internet Software (4) and Healthcare-Biomed/Genetic (3). The strongest sectors for breakouts were Retail (6) and Internet (5). |
|||||||||||||||||||||||||||||||
| NASDAQ | 2085.34 | 2.28% | 3.92% | enter | ||||||||||||||||||||||||||||||||
| S&P 500 | 1184.17 | 1.54% | 6.83% | enter | ||||||||||||||||||||||||||||||||
1The Market Signal is derived from our proprietary
market model. The market model is described on the site. |
||||||||||||||||||||||||||||||||||||
# of Breakouts
|
Period Average1
|
Max. Gain During Period2
|
Gain at Period Close3
|
|
|---|---|---|---|---|
| This Week | 47 | 42.77 | 7.55% | 6.05% |
| Last Week | 53 | 39.62 | 8.37% | 6.45% |
| 13 Weeks | 558 | N/A | 15.26% |
10.33% |
Sector
|
Industry
|
Breakout Count for Week
|
|---|---|---|
Internet
|
Internet-Software
|
4
|
Healthcare
|
Healthcare-Biomed/Genetic
|
3
|
Business Services
|
Business Svcs-Misc
|
2
|
Electronics
|
Electr-Semicndtr Mfg
|
2
|
Energy
|
Energy-Other Sources
|
2
|
Healthcare
|
Healthcare-Products
|
2
|
Internet
|
Internet-Secur/Network Svcs
|
2
|
Internet
|
Internet-E:Commerce
|
2
|
Personal
|
Personal -Cosmetics
|
2
|
Utility
|
Utility-Electric
|
2
|
Aerospace & Defense
|
Aerospace & Defense-Electr
|
1
|
Auto & Truck
|
Auto & Truck-US & Fgn Mfg
|
1
|
Beverages
|
Beverages-Soft Drink
|
1
|
Building
|
Building-Residentl/Comml
|
1
|
Building
|
Building-Maint & Services
|
1
|
Computer Software
|
Comp Software-Security
|
1
|
Computer Software
|
Comp Software-Healthcare
|
1
|
Computer Software
|
Comp Software-Enterprise
|
1
|
Diversified Operations
|
Diversified Operations
|
1
|
Finance
|
Finance-Consumer Loans
|
1
|
Finance
|
Finance-Misc Services
|
1
|
Healthcare
|
Healthcare-Med/Dent Services
|
1
|
Insurance
|
Insurance-Prop/Casualty/TItl
|
1
|
Insurance
|
Insurance-Life
|
1
|
Internet
|
Internet-ISP/Content
|
1
|
Machinery
|
Machinery-Const/Mining
|
1
|
Retail
|
Retail-Misc/Diversified
|
1
|
Retail
|
Retail-Department Stores
|
1
|
Retail
|
Retail-Apparel
|
1
|
Retail
|
Retail-Supermarkets
|
1
|
Special
|
Special-ClsdEndFunds/US Equity
|
1
|
Telecomm
|
Telecomm-Services US
|
1
|
Telecomm
|
Telecomm-Services Fgn
|
1
|
Transportation
|
Transportation-Equip Mfg
|
1
|
2This represents the return if each stock were bought at its breakout price and sold at its intra-day high.
3This represents the return if each stock were bought at its breakout price and sold at the most recent close.
Category |
Symbol |
Company Name |
Expected Gain1 |
|---|---|---|---|
| Top Technical | QSND | QSound Labs, Inc. | 93 |
| Top Fundamental | CVD | Covance Inc. | 41 |
| Top Tech. & Fund. | CVD | Covance Inc. | 41 |
Category |
Symbol |
Company Name |
Expected Gain1 |
|---|---|---|---|
| Best Overall | DFC | Delta Financial Corporation | 110 |
| Top Technical | SFCC | SFBC International, Inc. | 61 |
| Top Fundamental | SFCC | SFBC International, Inc. | 61 |
| Top Tech. & Fund. | SFCC | SFBC International, Inc. | 61 |
Recent changes to windows XP SP2 caused the export to Excel from the BaseWatch list to stop functioning. A replacement export function was introduced.
If we issue an alert on a stock with poor fundamentals, check its technical condition before writing it off
On Monday, we issued an alert for MYGN. I was immediately asked by a subscriber how a stock with such poor fundamentals as measured by our CANTATA Evaluator (CE) could be considered for purchase. MYGN went on to gain 6%, not our best performer for the week (which was PRVD + 28%) but not to be sneezed at either.
We'll look at the chart for MYGN in a moment, but first a little bit of theory and explanation about our site.
Stan Weinstein ("The Professional Tape Reader") says the market is a discounting mechanism in which stocks sell on future fundamentals, not historic ones, and all the information you need to know is already captured by the "tape". We start by heeding this advice.
A stock will appear on our cup-with-handle and double-bottom watchlists if it satisfies certain minimum technical criteria. That is, has an RS Rank of at least 70, average daily volume of 30,000 shares and a minimum price of $6. Additionally, the stock must be in either a cup-with-handle or double-bottom chart pattern. These patterns identify stocks with improving technical condition. In other words, the chart pattern tells us that the tape is telling us that these stocks are worth watching.
Our CE metric is a combination of technical (CET) and fundamental (CEF) measures. Because our selection is only on technical criteria, It is quite possible that the technical condition will be significantly better than the fundamental condition. Consequently, you will see several stocks on our watchlists with low overall CE's but relatively high CET's. We think this contributes to our competitive advantage because we find potential outperformers earlier in their base development. Many investors who use our approach look for early entry points to begin to build a position and add to such positions at subsequent "breakouts" as they stairstep up the right side of the cup to the "real" pivot point that is within 15% of the prior high. Such stocks will often be ranked poorly by Investor's Business Daily when they are still in the base and the score will increase as they move up in price toward the final pivot. Our site gives investors an opportunity to buy in earlier! Also, since many stocks will never make it above prior highs, our site also allows investors to profit from "inside" moves. This is the philosophy underlying our BaseWatch list. Finally, for those who are only looking for home runs, our Expected Gain can be used to help narrow the field to those early candidates with the best prospects. Win-win-win.
Our breakout alerts indicate that at the time they are issued, the market has a positive view of the future earnings potential of the stock. The market makes this judgment relative to all other stocks and consequently the market can judge that the future prospects of a stock with poor historic fundamentals merits paying a higher price for the stock. When this higher price is accompanied by significantly higher volume, the assumption is that a meaningful reassessment of the relative potential of the stock has taken place. Hence, the alert is issued. Of course, these relativities are continually being reassessed which leads to the dynamics of the market (and our frequent frustration!).
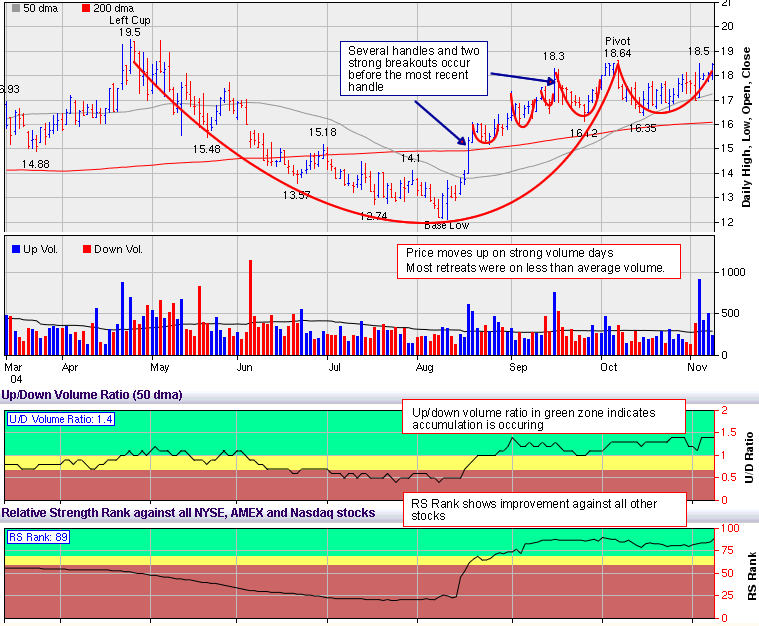
At the time of the alert MYGN had a low CE of only 8.25 (out of a possible 18) but a high CET of 5.95. The market was telling us that it thinks the future prospect of MYGN is better than its historic fundamentals would suggest. A look at the chart for MYGN as it was just prior to breakout tells an interesting story.
On 11/08/04 MYGN was actually in its fifth successive cup-with-handle pattern (see chart below) as it stair-stepped up the right side of its cup The price-volume pattern was encouraging with upward price moves on strong volume and minor retreats on mostly less than average volume. The Relative Strength Rank, which compares the stock's price movement against all other stocks over the last 12 months was also reflecting improvement. Our charts as they were on 11/08/04 clearly show these features:
Chart of MYGN before breakout on 11/08/04

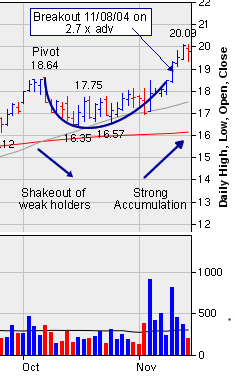
Chart of MYMG Handleand subsequent breakout
 The behavior in the handle was a classic example of what we like to see. Following
the formation of the pivot, the price dropped as weak holders took their profits.
Volume then declined to below the daily average for several days before accumulation
began again. Finally, volume picked up strongly before and on the breakout
day.
Using our methodology, it was possible to buy MYGN at $16 on 08/26 and be holding it today for a gain of 31%.
MYMG is an excellent example of a stock that fell out of favor and then began the slow process of rebuilding its base before moving on to successive highs. Our 'Expected Gain' model expects that MYMG will make a gain of 60% sometime in the next months following its breakout on 11/08.
If you received this newsletter from a friend and you would like to receive it regularly please go to the BreakoutWatch.com site and enter as a Guest.
Copyright © 2004 NBIcharts, LLC dba BreakoutWatch.com. All rights reserved.