| Market Summary | Weekly Breakout Report | Top Breakout Choices | Top 2nd Chances | New Features | Tip of the Week |
As I re-read last weeks commentary, I realize I could easily just reproduce it again this week, as the markets gave us more of the same. Oil price movements, the dollar, inflation fears, current account deficits and long term debt continued to dominate concerns with the result that the major indexes lost ground again this week. The DJI lost 1.3%, the S&P 500 0.9% and the NASDAQ was the biggest loser with a loss of 1.7%. The NASDAQ has now lost all its gains from the post-election rally.
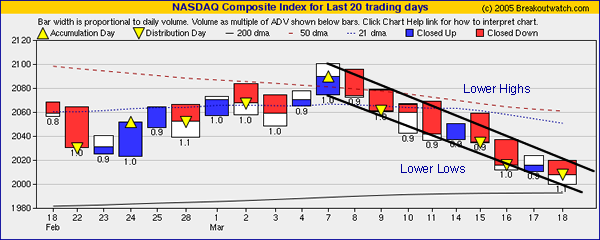
At its low on Friday, the NASDAQ came within 7 points of its 200 day moving average. Although it recovered from that point the overall trend continues downwards, as the following chart shows. It seems likely that the NASDAQ will test its 200 day moving average in the coming days, perhaps as early as Monday. If it fails to find support at that level, the next support level is around 1900, another 5% lower.

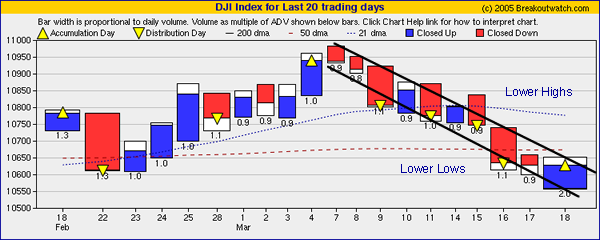
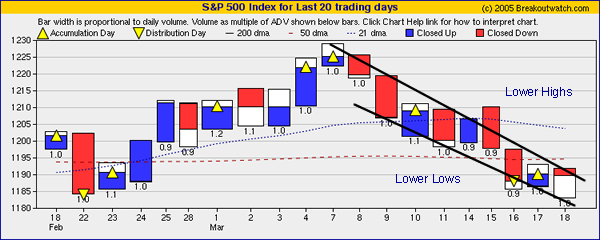
Unfortunately, the charts of the DJI and S&P 500 look similar. The high volume apparent accumulation day on the DJI yesterday can be discounted as it reflected churning as portfolio managers re-balanced their portfolio's in line with the re-balancing of the S&P 500.


Despite the slide in the markets, our breakouts performed relatively well. There were 27 this week, above the recent average, and on average they closed 1.6% higher, comfortably beating the losing market averages. CPC broke out of a flat base to gain 23%. BJRI broke out of a cup-with-handle to gain 14.7% and CRAI broke out of a double bottom to gain 14.2%.
Our Top Tip this week shows that most breakouts from cup-with-handle patterns come when the pivot is above the 90% level and that 80% of these go on to make an average gain of over 60%. Next week we will have backtesting results on our ShortsaleWatch candidates.
Oil and Gas drilling continued to be the top performing sector with Electrical and Scientific Instruments making the biggest improvement.
| Index | Value | Change Week | Change YTD | Market1 Signal |
||||||||||||||||||||||||||||||||||||
|---|---|---|---|---|---|---|---|---|---|---|---|---|---|---|---|---|---|---|---|---|---|---|---|---|---|---|---|---|---|---|---|---|---|---|---|---|---|---|---|---|
| Dow | 10629.7 | -1.34% | -1.42% | enter | ||||||||||||||||||||||||||||||||||||
| NASDAQ | 2007.79 | -1.66% | -7.71% | exit | ||||||||||||||||||||||||||||||||||||
| S&P 500 | 1189.63 | -0.87% | -1.84% | enter | ||||||||||||||||||||||||||||||||||||
1The Market Signal is derived from our proprietary
market model. The market model is described on the site. 2The site also shows industry rankings based on fundamentals, combined technical and fundamentals, and on price alone (similar to IBD). The site also shows daily industry movements. |
||||||||||||||||||||||||||||||||||||||||
# of Breakouts
|
Period Average1
|
Max. Gain During Period2
|
Gain at Period Close3
|
|
|---|---|---|---|---|
| This Week | 27 | 24.08 | 4.74% | 1.57% |
| Last Week | 16 | 24.92 | 3.76% | -0.38% |
| 13 Weeks | 332 | N/A | 12.89% |
1.32% |
Sector
|
Industry
|
Breakout Count for Week
|
|---|---|---|
Banks
|
Banks-Money Center
|
2
|
Electronics
|
Electr-Misc Products
|
2
|
Special
|
Special-ClsdEndFunds/Bond
|
2
|
Utility
|
Utility-Electric
|
2
|
Auto & Truck
|
Auto & Truck-OEM
|
1
|
Business Services
|
Business Svcs-Misc
|
1
|
Business Services
|
Business Svcs-Leasing
|
1
|
Computer
|
Computer-Services
|
1
|
Healthcare
|
Healthcare-Instruments
|
1
|
Insurance
|
Insurance-Life
|
1
|
Insurance
|
Insurance-Prop/Casualty/TItl
|
1
|
Machinery
|
Machinery-Const/Mining
|
1
|
Media
|
Media-Books
|
1
|
Office
|
Office-Supplies
|
1
|
Paper
|
Paper
|
1
|
Real Estate/ REIT
|
Real Estate Management
|
1
|
Retail
|
Retail-Auto Parts
|
1
|
Retail
|
Retail-Restaurant
|
1
|
Retail
|
Retail-Apparel
|
1
|
Retail
|
Retail-Supermarkets
|
1
|
Telecomm
|
Telecomm-Services Fgn
|
1
|
Transportation
|
Transportation-Ship
|
1
|
2This represents the return if each stock were bought at its breakout price and sold at its intraday high.
3This represents the return if each stock were bought at its breakout price and sold at the most recent close.
Category |
Symbol |
Company Name |
Expected Gain1 |
|---|---|---|---|
| Best Overall | CPWR | Compuware Corporation | 80 |
| Top Technical | VIDE | Video Display Corporation | 42 |
| Top Fundamental | EXP | Eagle Materials Inc | 0 |
| Top Tech. & Fund. | COH | Coach, Inc. | 1 |
Category |
Symbol |
Company Name |
Expected Gain1 |
|---|---|---|---|
| Best Overall | PSS | Payless Shoesource, Inc. | 53 |
| Top Technical | AEL | American Equity Investment Life Holding Company | 46 |
| Top Fundamental | TNP | Tsakos Energy Navigation Ltd | 14 |
| Top Tech. & Fund. | TNP | Tsakos Energy Navigation Ltd | 14 |
Pivot-height was added to our email-alerts and other reports as a consequence of the analysis done last week and confirmed again this week.
Breakout Performance from High Handles Revisited - Consequences of waiting for Breakout Confirmation
A mea culpa is in order! Last week, I analyzed the breakout performance of high handles in response to a question from a subscriber. In my eagerness to provide a response, my attention was on high handles and I didn't apply sufficient rigor to other aspects of the analysis. Unfortunately, there was a transcription error in that some of the results from the high handle performance were interchanged with the results from the 90-95 percentile range. This rendered invalid the conclusion that 98% of breakouts from the 90-95% range go on to make at least 5% . I sincerely regret the error and any reliance you may have made on it. This week I repeat the analysis and consider some of the consequences of it.
I discovered my error when looking at performance when the confirmed breakout closed within 0-5% of the pivot price on the day of the breakout. (The reason I was doing that is explained later). I've reworked the analysis and present the results below. The methodology and terminology used is described at the end of this section.The corrected analysis still confirms the conclusion that breakouts from high handles can make significant gains. Moreover, 82.6% of successful breakouts come from pivot heights greater than 90% and give an average maximum return of 28% within 90 days and 61.5% overall. As you might expect, breakouts from lower pivot heights give a better return but there are far fewer of them.
Performance by All Confirmed Breakouts
|
|||||||
Pivot Height %*
|
No. of Breakouts
|
Failures
|
Failure %
|
Successes
|
Success %
|
Avg. Max.% Gain in 90 Days
|
Avg. Max % Gain to Date |
|---|---|---|---|---|---|---|---|
> 100-105
|
680
|
107
|
15.7
|
564
|
82.9
|
28.7
|
64.6
|
> 95-100
|
696
|
89
|
12.8
|
601
|
86.4
|
26.3
|
57.8
|
> 90-95
|
339
|
84
|
24.8
|
252
|
74.3
|
30.7
|
63.2
|
> 85-90
|
147
|
21
|
14.3
|
126
|
85.7
|
35.5
|
85.4
|
> 80-85
|
58
|
8
|
13.8
|
50
|
86.2
|
29.2
|
61.9
|
> 75-80
|
22
|
8
|
36.4
|
14
|
63.6
|
44
|
91.8
|
> 70-75
|
3
|
1
|
33.3
|
1
|
33.3
|
22
|
22
|
* Measured as a % of the left side of the
cup
|
|||||||
There is a difficulty in turning this analysis into practical results, however.
The analysis above looks at all breakouts that were confirmed on the day of breakout, no matter what their closing price. Since almost 19% of breakouts close at more than 5% above their pivot, the gains shown in the analysis are only available to those who receive our alerts and can purchase the stock at or near the pivot price on the day of breakout. Our Silver subscribers do not receive real-time alerts, so they don't have the same opportunity to achieve the potential gains shown. Even for Gold and Platinum subscribers, who do receive alerts, there is an element of uncertainty since one cannot know at the time of the alert if the volume for the day will achieve the minimum 1.5 times average volume needed for a confirmed breakout. Consequently, it is of interest to know what the average gains are when the confirmed breakout is within 5% of the pivot on the day of breakout. We call these breakouts 'in range' because they are still potential buy candidates. They can be found every day in our Breakout Report.
Modifying the analysis to look only at confirmed breakouts that closed within 5% of the pivot price yields the following results:
Performance by All Confirmed Breakouts
that Close Within Range
|
|||||||
Pivot Height %*
|
No. of Breakouts
|
Failures
|
Failure %
|
Successes
|
Success %
|
Avg. Max % Gain in 90 Days
|
Avg. Max. % Gain to Date |
|---|---|---|---|---|---|---|---|
> 100-105
|
559
|
104
|
18.6
|
455
|
81.4
|
19.9
|
48.3 |
> 95-100
|
560
|
87
|
15.5
|
473
|
84.5
|
19.7
|
46.2 |
> 90-95
|
278
|
84
|
30.2
|
194
|
69.8
|
18.9
|
40.7 |
> 85-90
|
125
|
21
|
16.8
|
104
|
83.2
|
24.2
|
59.8 |
> 80-85
|
41
|
8
|
19.5
|
33
|
80.5
|
26.6
|
55.6 |
> 75-80
|
19
|
8
|
42.1
|
11
|
57.9
|
21.6
|
54.7 |
> 70-75
|
2
|
1
|
50
|
1
|
50
|
0
|
0 |
* Measured as a % of the left side of the
cup
|
|||||||
The important result from this analysis is that by waiting for the breakout to be confirmed at the end of the day, and by buying only breakouts who's pivot was 90% or more of the left cup height, you will still have an 80% chance that the stock will gain 5% or more above its pivot for an average gain of 19.6% within 90 days and 46.1% overall. The downside is that you must accept buying the stock at above the optimal point and a much lower potential gain. On average, breakouts that close within range do so 1.8% above the pivot, and go on to make 15.4% less. The net 'cost' of waiting for a confirmed breakout is therefore an average of 17.2%.
This table summarizes these results:
Performance by Breakouts where
Pivot is above 90% of Left Cup
|
|||||||
Pivot Height %*
|
No. of Breakouts
|
Failures
|
Failure %
|
Successes
|
Success %
|
Avg. Max % Gain in 90 Days
|
Avg. Max. % Gain to Date |
|---|---|---|---|---|---|---|---|
All Breakouts
|
1715
|
280
|
16.3
|
1417
|
82.6
|
28.0
|
61.5
|
Breakouts In-Range
|
1397
|
275
|
19.7
|
1122
|
80.3
|
19.6
|
46.1
|
Methodology and Terminology
The study covered all confirmed breakouts from our cup-with-handle watchlist since April 1, 2003 through to December 31, 2004. Performance was measured from breakout date for 90 days (3 months) and from breakout date through to March 17,2005 (referred to as 'to Date' in the above tables).
A confirmed breakout occurs when a stock closes above its pivot price on at least 1.5 times average daily volume.
A confirmed breakout is in-range when it closes at no more than 5% above its pivot on the day of breakout.
A success occurs when the stock gains 5% or more over its pivot price. If this occurs after it has first failed, it is not counted as a success.
A failure occurs when the stock does not rise to at least 5% above its pivot price and then falls to more than 8% below the pivot price.
Stocks that remain between the failure and success levels are not shown in the analysis which is why the failures and successes do not add up to 100%.
The maximum gain is the highest close (not intra-day high) that a successful stock achieved after breakout in either the first 90 days or through to 3/17/05
The average maximum gain is the mean maximum gain of all successes in the group.
If you received this newletter from a friend and you would like to receive it regularly please go to the BreakoutWatch.com site and enter as a Guest. You will then be able to register to receive the newsletter.
Copyright © 2005 NBIcharts, LLC dba BreakoutWatch.com. All rights reserved.