| Market Summary | Weekly Breakout Report | Top Breakout Choices | Top 2nd Chances | New Features | Tip of the Week |
In last weekend's newsletter, I suggested that the day before the long weekend should be a considered a distribution day, despite the lighter volume. If so, it would have caused our market model to signal an exit for the DJI. That hunch may have been correct because this week we saw further erosion in the DJI and NASDAQ, which lost 0.4% and 0.3% respectively. On purely technical grounds, our market model still shows an 'enter' for the DJI, but I discount that and consider that in general it is better to be in cash, than be invested in long positions. The DJI tested its 200 day moving average on Friday and recovered from it. We shall wait and see if this support level holds. This cloud does have a silver lining, however. The S&P 500 actually closed the week with a slender gain of 0.1% and Tuesday's low on the S&P 500 and NASDAQ Composite was not taken out later in the week, so we may have seen a bottom for the moment. However, until the news cycle of higher oil prices accompanied by inflation fears is broken, we are likely to continue in this market correction.
Inevitably, this was not a good week for breakouts, with just 11 of 37 attempts being successful for an average gain of 1.4%. There were few standout performers with only SDS, ALSK and HITK making more than 5% above their pivots. With only one or two exceptions, the recent breakouts have come from stocks with excellent technical scores but lagging fundamentals. Of the 11 breakouts this week, 10 scored a 4 (the best) in our technical zone ranking while only one scored a 4 in our fundamental zone ranking. This is further confirmation that the technical rank is a better indicator of what the market believes is the future potential of the stock, rather than the fundamental ranking, which mainly assesses past performance. In our Tip of the Week this week we show you how to find stocks with excellent technical scores (or any other score) using our database search service.
ShortsaleWatch, which we discussed in last week's newsletter's Tip of the Week, started to offer some significant gains this week. Over the last month, we issued 30 breakdown alerts. Of these, only 4 have recovered to be above their 50 dma, with the rest in negative territory with an average loss of 5.5%. By going short based on ShortsaleWatch, one would have comfortably beaten the markets over the same period. If you are looking for possible short sales, don't ignore the Breakdown Report as this contains stocks that have already shown significant weakness and can breakdown further. As an example, CME was the first stock that we issued a breakdown alert for when it crossed its 50 day moving average at 210 on March 2. It closed yesterday at 183.50 for a loss of 12.6% since then. Other sizable losers are UNA, 12.6% and GT, 10%.
| Index | Value | Change Week | Change YTD | Market1 Signal |
||||||||||||||||||||||||||||||||||||
|---|---|---|---|---|---|---|---|---|---|---|---|---|---|---|---|---|---|---|---|---|---|---|---|---|---|---|---|---|---|---|---|---|---|---|---|---|---|---|---|---|
| Dow | 10404.3 | -0.37% | -3.51% | enter | ||||||||||||||||||||||||||||||||||||
| NASDAQ | 1984.81 | -0.31% | -8.76% | exit | ||||||||||||||||||||||||||||||||||||
| S&P 500 | 1172.92 | 0.13% | -3.22% | enter | ||||||||||||||||||||||||||||||||||||
1The Market Signal is derived from our proprietary
market model. The market model is described on the site. 2The site also shows industry rankings based on fundamentals, combined technical and fundamentals, and on price alone (similar to IBD). The site also shows daily industry movements. |
||||||||||||||||||||||||||||||||||||||||
# of Breakouts
|
Period Average1
|
Max. Gain During Period2
|
Gain at Period Close3
|
|
|---|---|---|---|---|
| This Week | 11 | 23.38 | 5.82% | 1.41% |
| Last Week | 12 | 23.62 | 6.67% | 2% |
| 13 Weeks | 324 | N/A | 12.93% |
0.8% |
Sector
|
Industry
|
Breakout Count for Week
|
|---|---|---|
Media
|
Media-Cable/Satellite TV
|
2
|
Chemical
|
Chemical-Specialty
|
1
|
Computer
|
Computer-Storage Devices
|
1
|
Computer Software
|
Comp Software-Enterprise
|
1
|
Computer Software
|
Comp Software-Financial
|
1
|
Healthcare
|
Healthcare-Drugs/Generic
|
1
|
Insurance
|
Insurance-Life
|
1
|
Retail
|
Retail-Supermarkets
|
1
|
Retail
|
Retail-Consumer Electr
|
1
|
Telecomm
|
Telecomm-Services US
|
1
|
2This represents the return if each stock were bought at its breakout price and sold at its intraday high.
3This represents the return if each stock were bought at its breakout price and sold at the most recent close.
Category |
Symbol |
Company Name |
Expected Gain1 |
|---|---|---|---|
| Best Overall | CPWR | Compuware Corporation | 63 |
| Top Technical | ALDA | Aldila, Inc. | 26 |
| Top Fundamental | XEC | Cimarex Energy Co | 0 |
| Top Tech. & Fund. | CNTY | Century Casinos, Inc. | 33 |
Category |
Symbol |
Company Name |
Expected Gain1 |
|---|---|---|---|
| Best Overall | WDC | Western Digital Corporation | 48 |
| Top Technical | GEAC | Geac Computer Corporation Ltd | 45 |
| Top Fundamental | WDC | Western Digital Corporation | 48 |
| Top Tech. & Fund. | AEL | American Equity Investment Life Holding Company | 36 |
A bug affecting the Breakdown Report display in Internet Explorer was corrected.
Search our Database to Find Quality Stocks
Our name may lead you to believe our service is limited to watchlists of stocks in specific patterns ready to breakout (CwH, Flat Bottom, Double Bottom) or break down (ShortsaleWatch and Flat Bottom). This is not so, we also offer the ability to find stocks building their bases (BaseWatch), stocks in top performing or rising industry groups (Industry Analysis) or even search our entire database (all common US stocks) for stocks meeting any range of metrics the CANTATA investor may want. Previous newsletters have given pointers on using BaseWatch and Industry Analysis and today we focus on our Database Search ability.
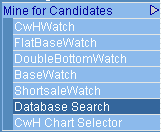 The Database Search is accessed from the Mine for Candidates Menu option.
There are two ways to search the database. You can either select one of our 'Top 100' lists or build a more selective set of criteria.
Select a Top 100 List
To select one of the top 100 lists, simply select one and click the Search Database button.
![]()
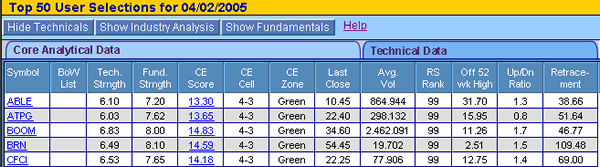
These searches will return the 100 stocks with the highest technical score, fundamental score or CANTATA Evaluator (CE) score from our database. As an example, here are the top 5 stocks from our current Top 100 CE search.
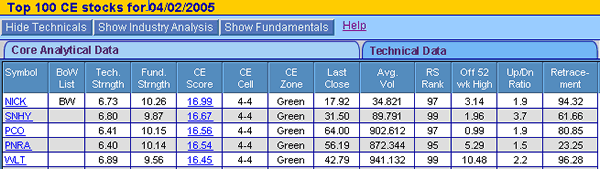
The display will open with the technical data displayed. Clicking the 'Show Industry Analysis' or 'Show Fundamentals' will buttons will show that data also. Click a 'Hide' button to reduce the display width to fit within your monitor.
More Selective Search
To be more selective, first choose a group of stocks to search on:

Then choose a set of selection criteria, you can search by Zone, Technical Criteria, Fundamental Criteria, or any combination thereof.
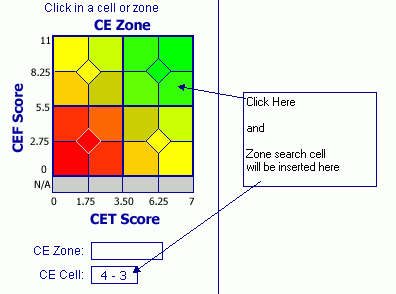
For example, most breakouts lately have been coming from stocks in zone 4-3 (that means top technicals and moderately strong fundamentals). To select stocks in Zone 4-3 just click the zone diagram as shown:
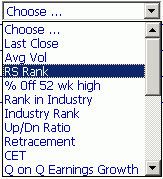
 Finally,
choose a sort criterion and click the database search button. The search will
return the top 50 stocks meeting the search criteria.
Finally,
choose a sort criterion and click the database search button. The search will
return the top 50 stocks meeting the search criteria.
Here are the top 5 that the search would display today.
This brief overview has only scratched the surface of the power of our Database Search service. The database can also be searched by the individual technical and or fundamental metrics used in our CANTATA Evaluator tool. In summary, our Database Search gives unequaled power in selecting stocks for the CANTATA investor.
If you received this newletter from a friend and you would like to receive it regularly please go to the BreakoutWatch.com site and enter as a Guest. You will then be able to register to receive the newsletter.
Copyright © 2005 NBIcharts, LLC dba BreakoutWatch.com. All rights reserved.