| Market Summary | Weekly Breakout Report | Top Breakout Choices | Top 2nd Chances | New Features | Tip of the Week |
This was the worst week of the year so far for the major indexes. The DJI lost 3.6%, the NASDAQ Composite 4.6% and the S&P 500 3.3%. The week closed with three consecutive distribution days on the DJI and S&P 500 and two on the NASDAQ. Volume increased substantially on Friday to 50% above average daily volume. Friday's steep decline was triggered by reports from the Federal Reserve of lower manufacturing and industrial production and the Labor Department reported that higher oil costs were driving up import prices.
The NASDAQ has closed below its 200 day moving average since April 13, the DJI since Thursday and the S&P 500 finally broke through the 200 dma on Friday. We would like to see a capitulation day which would allow us to get the decline behind us so we can start to see some healthy breakouts again. Since Friday was the worst day in nearly two years, following on two days of increasingly negative volume, could Friday have been a capitulation day? We can only know after the fact, but as the markets closed at their lows of the day, it is likely that there is more downside to this slide yet. Some positive earnings results could turn the corner, but the overall macro-economic environment is otherwise unsuitable for a return to bullish conditions.
Despite the terrible week for the markets, there were still 24 successful breakouts, some of them being spectacularly successful. DNA rocketed out of a cup-with-handle base with solid technical, fundamental and Chart Quality (CQ) scores on Friday to gain almost 20% before slipping back to a gain of 16.8% above its pivot. KOSP also had excellent technical fundamental and CQ scores to breakout on Wednesday for a gain of 12% before slipping back to a 9.5% gain in three days.
As could be expected, the breakdown count for the week increased, with 25 confirmed to have closed down on at least 1.5 times average volume. TGI lost 16.7%, FLSH 15.3%, VRSN 8.5% and HBHC 6.8%. If the markets turn increasingly bearish, we can expect better returns from breakdowns than breakouts. Consequently, we take another look at the factors influencing successful short sales in this weeks Tip of the Week.
| Index | Value | Change Week | Change YTD | Market1 Signal |
||||||||||||||||||||||||||||||||||||
|---|---|---|---|---|---|---|---|---|---|---|---|---|---|---|---|---|---|---|---|---|---|---|---|---|---|---|---|---|---|---|---|---|---|---|---|---|---|---|---|---|
| Dow | 10087.5 | -3.57% | -6.45% | enter | ||||||||||||||||||||||||||||||||||||
| NASDAQ | 1908.15 | -4.56% | -12.29% | exit | ||||||||||||||||||||||||||||||||||||
| S&P 500 | 1142.62 | -3.27% | -5.72% | enter | ||||||||||||||||||||||||||||||||||||
1The Market Signal is derived from our proprietary
market model. The market model is described on the site. 2The site also shows industry rankings based on fundamentals, combined technical and fundamentals, and on price alone (similar to IBD). The site also shows daily industry movements. |
||||||||||||||||||||||||||||||||||||||||
# of Breakouts
|
Period Average1
|
Max. Gain During Period2
|
Gain at Period Close3
|
|
|---|---|---|---|---|
| This Week | 24 | 24.23 | 0.96% | -4.45% |
| Last Week | 25 | 24.38 | 6.09% | -2.23% |
| 13 Weeks | 355 | N/A | 11.82% |
-4.56% |
Sector
|
Industry
|
Breakout Count for Week
|
|---|---|---|
Banks
|
Banks-Southeast
|
2
|
Insurance
|
Insurance-Prop/Casualty/TItl
|
2
|
Aerospace & Defense
|
Aerospace & Defense-Mfg
|
1
|
Aerospace & Defense
|
Aerospace & Defense-Equip
|
1
|
Banks
|
Banks-Midwest
|
1
|
Banks
|
Banks-Northeast
|
1
|
Business Services
|
Business Svcs-Misc
|
1
|
Computer
|
Computer-Services
|
1
|
Computer Software
|
Comp Software-Educ/Enter
|
1
|
Computer Software
|
Comp Software-Enterprise
|
1
|
Electronics
|
Electr-Equipment
|
1
|
Finance
|
Finance-Brokers
|
1
|
Healthcare
|
Healthcare-Biomed/Genetic
|
1
|
Healthcare
|
Healthcare-Outpnt/HmCare
|
1
|
Healthcare
|
Healthcare-Drugs/Ethical
|
1
|
Healthcare
|
Healthcare-Products
|
1
|
Healthcare
|
Healthcare-Med/Dent Services
|
1
|
Insurance
|
Insurance-Diversified
|
1
|
Leisure
|
Leisure-Products
|
1
|
Media
|
Media-Cable/Satellite TV
|
1
|
Retail
|
Retail-Supermarkets
|
1
|
Telecomm
|
Telecomm-Wireless Services
|
1
|
2This represents the return if each stock were bought at its breakout price and sold at its intraday high.
3This represents the return if each stock were bought at its breakout price and sold at the most recent close.
Category |
Symbol |
Company Name |
Expected Gain1 |
|---|---|---|---|
| Best Overall | MIKR | MIKRON INFRARED INC | 75 |
| Top Technical | CYBX | CYBERONICS INC | 0 |
| Top Fundamental | RRGB | RED ROBIN GOURMET BURGERS IN | 0 |
| Top Tech. & Fund. | RRGB | RED ROBIN GOURMET BURGERS IN | 0 |
Category |
Symbol |
Company Name |
Expected Gain1 |
|---|---|---|---|
| Best Overall | PTMK | PATHMARK STORES INC NEW | 57 |
| Top Technical | NLS | NAUTILUS GROUP INC | 5 |
| Top Fundamental | BBBB | BLACKBOARD INC. | 9 |
| Top Tech. & Fund. | BBBB | BLACKBOARD INC. | 9 |
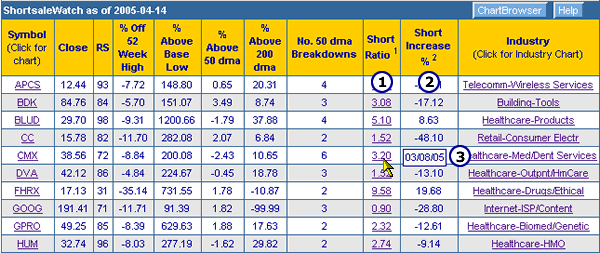
Short Interest data was added to ShortsaleWatch. See the next section for more information.
Since releasing the ShortsaleWatch service, we have received several helpful suggestions from subscribers. This week it was suggested that we add 'Short Interest' to the display and we did so on Friday. As of next Monday, short interest will also be shown on breakdown alerts. Some of you may be asking, "what is short interest?" and if so I suggest you read the excellent description here.
On our ShortsaleWatch display we show three items of short interest information:
1. Short Ratio. The ratio of uncovered short sales to share
float for the reporting period. This is also known as the days to cover, that
is the number of days of average daily volume trading needed for all short
positions to be covered.
2. The Short Interest Increase: The % increase in uncovered
short sales for the reporting period versus the previous reporting period.
3.
The Reporting Date. This is shown by placing your mouse over
the Short Ratio number. This can be different for each exchange on which the
stock is
traded.

So how should we interpret this information for our short selling purposes?
The first thing to consider is that the information can be substantially out of date, up to 6 weeks in fact, because the short interest is only reported monthly, and disseminated 2 weeks later (the publication schedule for NASDAQ data is available here). However, it does give a view of what the institutional sentiment is with regard to the future of a stock. If we believe in the importance of 'I' in CANTATA, then this is valuable information. An increasing short interest indicates that institutions are becoming increasingly bearish about the future prospects of the stock. If the technical condition now is similar to what it was on the report date, then that bearish sentiment probably still prevails.
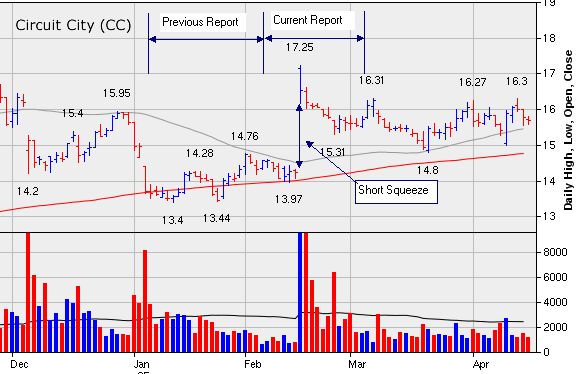
Secondly, a high short ratio is a danger sign because it can lead to you being caught in a 'short squeeze' as short sellers rush to cover their positions and the sudden increase in demand causes a price spike. In the data above, we can see a good example of a short squeeze in the case of Circuit City (CC) where the short ratio came down almost 50% from the previous reporting period, indicating that there had been a lot of covering of short positions. If we look at a chart for CC we can understand why this so.

After strong selloffs at the beginning of January and and again at the beginning of February, there was still short interest in the previous reporting period. Then came the strong gap-up above the 50 dma in mid-February that caused the shorts to cover. So if you were a short seller in February at, say, $14.00, you were forced to cover in what's called a 'short squeeze' at up to $17 for a 21% loss. Since early March, CC has essential tread water on low volume but a break below the 50 dma would be a sign that the bearish sentiment of January has returned.
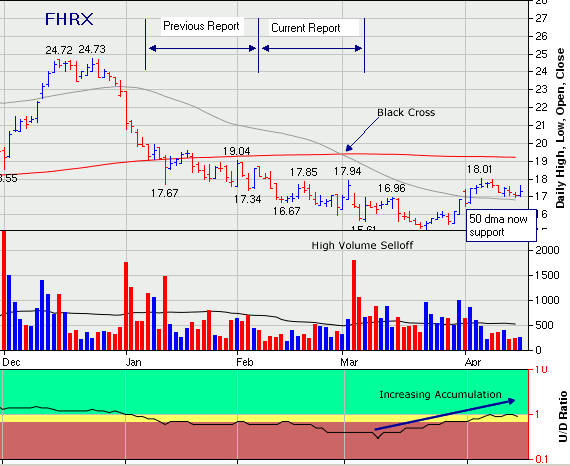
Because of the short squeeze effect, contrarians think that a high short ratio can be a buy signal if the stock starts to recover. In the data above, FHRX has a high Short Ratio (9.6) which had increased by 20% over the previous reporting period. The chart below shows that towards the end of the current reporting period, a 'black-cross' triggered a high volume selloff which must have given the shorts new reason to increase their short positions. Instead the stock stabilized and an accumulation phase began as can be seen from the U/D Volume chart. The 50 dma is now a support level and the stock looks as though it could enter a Weinstein type stage 2 base if it rises above resistance at $18.01.

Conclusion
Short interest, coupled with the direction in which it is moving, can be a useful guide to institutions' sentiment regarding a stock. Stocks with high and increasing short interest are not usually good candidates for shorting, however.
How to Rank Stocks on ShortsaleWatch
We were also asked this week how to rank stocks on ShortsaleWatch. Until we have a longer experience with the list, we can only give general guidelines, as follows
1. Use the ChartBrowser to evaluate the chart pattern by eye. Look for stocks
that are breaking down from topping patterns, such as head-and-shoulders and
double tops. This is possibly the most important single guide to a potential
short sale.
2. Look at the number of times it has crossed the 50 dma to the downside since
making its high. This number is shown on ShortsaleWatch and the higher the
number of times, then the more likely that it will eventually break down, but
only if other conditions mentioned here are met.
3. Look for declining RS Rank and RS Line. These are necessary conditions for
the stock to be on ShortsaleWatch, in any case.
4. Look for declining Up/Down Volume. This is an indication that distribution
is taking place
If you received this newletter from a friend and you would like to receive it regularly please go to the BreakoutWatch.com site and enter as a Guest. You will then be able to register to receive the newsletter.
Copyright © 2005 NBIcharts, LLC dba BreakoutWatch.com. All rights reserved.