| Market Summary | Weekly Breakout Report | Top Breakout Choices | Top 2nd Chances | New Features | Tip of the Week |
Open House on Breakout Alerts
We are introducing a new alert monitoring service which will go into beta test on Monday, August 15. This service is free to all subscribers and guests until August31 and can be accessed from our Take Action - Alerts menu choice at breakoutwatch.com. Read more in this weeks Top Tip below.
Market Summary
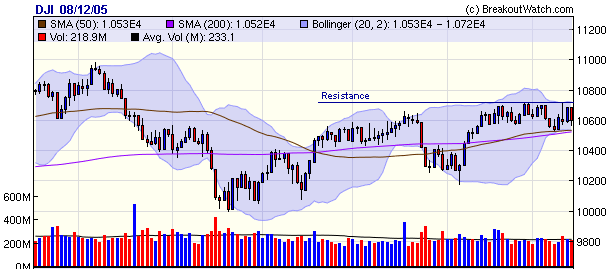
The DJI rebounded from its 50 day moving average level on Monday and went on to finish the week with a gain of 0.4%. While the long term trend is to move higher, the index has recently met resistance at 10700 and continues to consolidate below that level. With oil prices continuing to rise, it seems that the market has decided that for now there is a real limit to growth of large cap stocks.

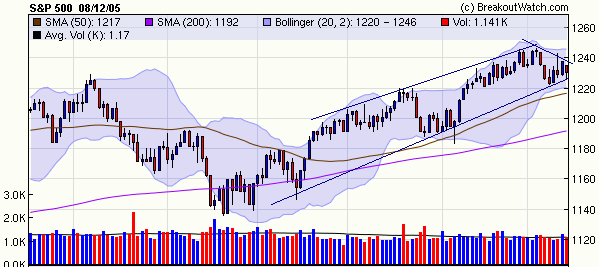
The bigger picture for the S&P 500 is more bullish with a clear rising channel establishing a positive upwards trend. However, over the last eight days a bearish triangle has appeared and resistance was established on Wednesday this week with a breakout attempt being rebuffed at 1240.

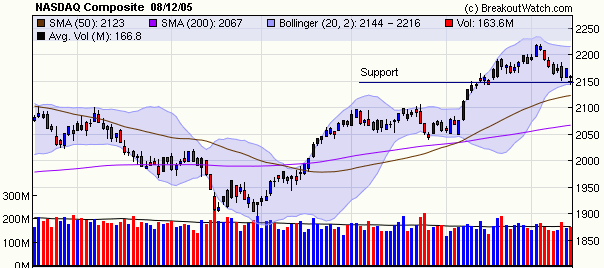
The NASDAQ composite is in retreat from its 2219 high on August 3 but found support on Friday, after earnings warnings from DELL, at 2150. That is also the edge of the lower Bollinger Band and a recovery from here to 2200 is possible. A violation of support would probably mean a retreat to the 50 day moving average level at around 2120.

There were 30 breakouts this week, down from the recent average of 41 over the last 13 weeks. Several made double digit gains on breakout from cup-with-handle bases, such as MTZ (Mastec Inc) that rose 19%, PQUE (Petroquest Energy, Inc.) that rose 15.8%, KNOT (The Knot Inc.) with a gain of 13.1% and LMIA (LMI Aerospace) which gained 11.36%.
Oil and Gas stocks continued to top the industry performance charts, as they have done for the last 26 weeks. Real Estate Development was the most improved industry group rising 9 steps on our industry rankings to 21st position out of 192 groups.
Get a 14 day Trial of our premium 'Platinum' service for just $9.95 and if you subsequently subscribe to any subscription level we will credit your $9.95 to your subscription. 14
Day Platinum Trial |
A new alert monitoring service will be introduced on Monday, August 15.
New Alert Monitor Provides One-Stop Access to all Due Diligence Needs
Starting on Monday, August 15, we will introduce a new Alert Monitor page that provides access to all information necessary to perform essential due diligence on stocks about to break out.
This will be on beta test until August 31 and thereafter will become a separately priced service. All subscribers and guests will have free access to this service until then. It will be accessed from the Take Action - Alerts menu option. We invite your comments for improvements to this service, as usual.
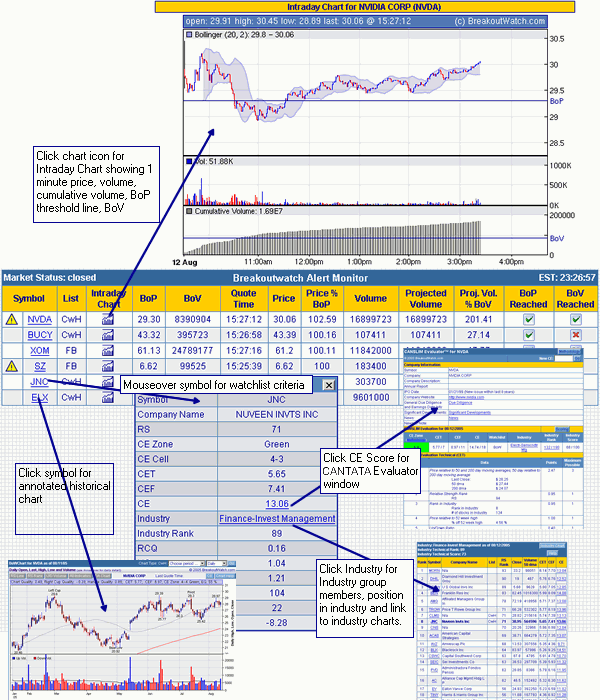
The Alert Monitor will display all stocks on the CwH, Flat Base and Double bottom watchlists for which either, we have issued an alert, or are at or above their pivot price.The Alert Monitor will show:
- An alert symbol (
 ) if
an alert has been issued
 - The symbol with a mousover link to critical information from the watchlist and a click link to bring up the annotated historical BoW chart for the symbol
- The relevant watchlist (CwH, FB or DB)
- An intraday chart icon which when clicked brings up an intraday chart for
the symbol showing:
- price and volume at 1 minute intervals
- cumulative volume
- BoP threshold
- BoV threshold
- Breakout price (BoP)
- Breakout Volume (BoV)
- Latest quote time
- Latest price and volume (1 minute intervals)
- Latest price as a % of BoP
- Projected volume
- Projected volume as % of BoV
- Indicators for BoP and BoV being reached
- Link to the CANTATA Evaluator for the stock
- Link to the Industry Group for the stock, showing the industry rank, stock rank to the industry and further links to the industry analysis charts.
The following schematic illustrates what will be available:

A demo of this service as of 3:57 pm EST on Friday is available now at Take Action - Alerts. The service will be live at 9:30 am EST on Monday, August 15.
Get a 14 day Trial of our premium 'Platinum' service for just $9.95 and if you subsequently subscribe to any subscription level we will credit your $9.95 to your subscription. 14
Day Platinum Trial |
| Index | Value | Change Week | Change YTD | Market1 Signal |
||||||||||||||||||||||||||||||||||||
|---|---|---|---|---|---|---|---|---|---|---|---|---|---|---|---|---|---|---|---|---|---|---|---|---|---|---|---|---|---|---|---|---|---|---|---|---|---|---|---|---|
| Dow | 10600.3 | 0.4% | -1.69% | enter | ||||||||||||||||||||||||||||||||||||
| NASDAQ | 2156.9 | -0.96% | -0.85% | enter | ||||||||||||||||||||||||||||||||||||
| S&P 500 | 1230.39 | 0.32% | 1.52% | enter | ||||||||||||||||||||||||||||||||||||
1The Market Signal is derived from our proprietary
market model. The market model is described on the site. 2The site also shows industry rankings based on fundamentals, combined technical and fundamentals, and on price alone (similar to IBD). The site also shows daily industry movements. |
||||||||||||||||||||||||||||||||||||||||
# of Breakouts
|
Period Average1
|
Max. Gain During Period2
|
Gain at Period Close3
|
|
|---|---|---|---|---|
| This Week | 30 | 39.77 | 4.29% | 0.94% |
| Last Week | 44 | 39.54 | 6.64% | -0.09% |
| 13 Weeks | 540 | 41.38 | 15.89% |
6.33% |
Sector
|
Industry
|
Breakout Count for Week
|
|---|---|---|
Special
|
Special-ClsdEndFunds/Bond
|
3
|
Electronics
|
Electr-Semicndtr Mfg
|
2
|
Mining
|
Mining-Gold/Silver/Gems
|
2
|
Oil & Gas
|
Oil & Gas-Field Services
|
2
|
Oil & Gas
|
Oil & Gas-U S Explr/Prod
|
2
|
Retail
|
Retail-Misc/Diversified
|
2
|
Aerospace & Defense
|
Aerospace & Defense-Equip
|
1
|
Auto & Truck
|
Auto & Truck-US & Fgn Mfg
|
1
|
Banks
|
Banks-Northeast
|
1
|
Containers
|
Containers
|
1
|
Electronics
|
Electr-Equipment
|
1
|
Finance
|
Finance-Misc Services
|
1
|
Healthcare
|
Healthcare-Biomed/Genetic
|
1
|
Healthcare
|
Healthcare-Products
|
1
|
Healthcare
|
Healthcare-Drugs/Ethical
|
1
|
Internet
|
Internet-ISP/Content
|
1
|
Internet
|
Internet-Software
|
1
|
Leisure
|
Leisure-Movies & Related
|
1
|
Metal Prds
|
Metal Prds-Pipe/Fab/Misc
|
1
|
Oil & Gas
|
Oil & Gas-Refining/Mktg
|
1
|
Real Estate/ REIT
|
Real Estate Management
|
1
|
Retail
|
Retail-Mail Order/Direct
|
1
|
Telecomm
|
Telecomm-Equipment
|
1
|
2This represents the return if each stock were bought at its breakout price and sold at its intraday high.
3This represents the return if each stock were bought at its breakout price and sold at the most recent close.
Category |
Symbol |
Company Name |
Expected Gain1 |
|---|---|---|---|
| Best Overall | APLX | APPLIX INC | 123 |
| Top Technical | DKHR | D & K HEALTHCARE RES INC | 61 |
| Top Fundamental | ESV | ENSCO INTL INC | 20 |
| Top Tech. & Fund. | GEOI | GEORESOURCES INC | 64 |
Category |
Symbol |
Company Name |
Expected Gain1 |
|---|---|---|---|
| Best Overall | WEBM | WEBMETHODS INC | 110 |
| Top Technical | LMIA | LMI AEROSPACE INC | 109 |
| Top Fundamental | CBH | COMMERCE BANCORP INC N J | 52 |
| Top Tech. & Fund. | CBH | COMMERCE BANCORP INC N J | 52 |
If you received this newletter from a friend and you would like to receive it regularly please go to the BreakoutWatch.com site and enter as a Guest. You will then be able to register to receive the newsletter.
Copyright © 2005 NBIcharts, LLC dba BreakoutWatch.com. All rights reserved.