| Market Summary | Weekly Breakout Report | Top Breakout Choices | Top 2nd Chances | New Features | Tip of the Week |
Market Summary
The markets breathed a sigh of relief this week as they saw oil and gasoline prices falling and investors looked ahead to the positive benefits to the economy of reconstruction after Hurricane Katrina. There was also optimism that the Fed may ease its raising of interest rates in the near future as they assess the economic impact of the Hurricane. The end-result was that the markets closed higher with their best performance for several weeks. For the week, the DJI gained 2.21%, the NASDAQ Composite rose 1.61% and the S&P 500 added 1.93%. For the year, the DJI is still below water, by 0.97%, the NASDAQ has returned to break-even, and the S&P 500 has gained 2.44%.
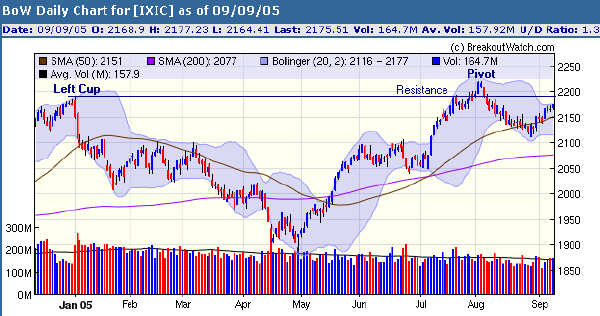
On Tuesday, our market model reversed the exit signal it had issued last week after the NASDAQ closed 2.6% above the low set on August 29. The NASDAQ chart, like those of the other indexes, shows that the index is tracing the right side of a handle in a cup-with-handle formation at the upper limit of its Bollinger Band. This, in itself, does not mean that the index cannot move higher, as we saw in our discussion of Bollinger Bands from two weeks ago. If the index does move higher, it will meet resistance at the left cup level, and if it moves lower it will find support at the 50 day moving average level. For the NASDAQ this range is between 2190 and 2150. Since the threat of economic damage from oil prices has not really abated, it is difficult to see where the impetus to push substantially higher will come from and we could see all the indexes trade within a relatively narrow range in the coming weeks.

The number of confirmed breakouts rose this week to 29, just below the recent average level. ALNY (Alnylam Pharmaceuticals) gained 34% intraweek and closed for a gain of 31% over its pivot. Another high-flyer was SIGM (Sigma Designs) which made an intra-week gain of 21% before profit taking reduced its gain over its pivot to 13%.
Oil & Gas continues to be the best performing industry with real Estate Development being the most improved. Oil & Gas contributed 4 breakouts, while Healthcare continues to perform well with 5 breakouts.
Get a 14 day Trial of our premium 'Platinum' service for just $9.95 and if you subsequently subscribe to any subscription level we will credit your $9.95 to your subscription. 14
Day Platinum Trial |
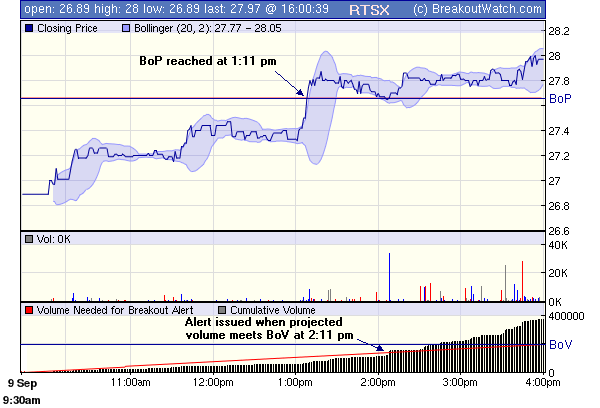
Further enhancements were made to the Alert Monitor and Intraday Charts
-
 You can now monitor stocks on your Personal Watchlist and
or Filters. These are displayed regardless of the BoP and/or BoV being
reached or an alert being issued if the appropriate option is selected
from the drop down Monitor list at the top right of the Alert Monitor display.
- New icons were added to show the status of stocks on the list

- The intraday chart now shows the relationship of the actual accumulated
volume to the volume needed to trigger an alert.

Finding Promising Stocks Among Technically Failed Breakouts
It is quite common for a stock to set a new intraday high and then fail to breakout according to our strict definition of a breakout. In that case, the stock will drop off the the watchlist and will only reappear if a new handle is formed. Some of these stocks have great potential, however, and will continue to move up without setting a new handle. There are two situations that can occur and our new Alert Monitor screen provides a way to recognize these.
1. The Stealth Breakout
Savvy institutions will accumulate stocks in parcel quantities and over periods of time that will not drive up the price excessively. This can lead to what we call a 'stealth' breakout where the price rises above the breakout price, but the volume is accumulated over several days, rather than on the breakout day itself. These breakouts are hard to track and are not picked up by our algorithms but potential stealth breakouts can be spotted using the new Alert Monitor tool after the market has closed. For example, on Thursday, ZRAN headed the list of stocks we were tracking on the Alert Monitor because it had the highest gain over its breakout price, but it closed at 98% of its needed breakout volume - close enough to be considered a breakout but classified as a failed attempt by the computer that deals in absolute percentages only.

On Friday, ZRAN added another 1.5%.
2. Pullback before close on high volume
It is quite common to see a stock pull back on profit taking after a high volume breakout, sometimes in the same day as the breakout, but then continue to rise. Another example from Thursday is CMVT which broke out of a flat base intraday on 3.6 times average volume but closed just below its BoP. On Friday it gained 2.5% over its opening price on 2.5 times average volume.

Conclusion
If you bought either of these stocks intraday on our breakout alert, you may have been disappointed at the close and been tempted to sell. The statistics provided through the Alert Monitor, which provides easy access to all the due diligence tools and charts you need, can help you decide whether or not to keep your holding.
If you buy only confirmed breakouts, then check the Alert Monitor for near misses - you may find some good investments.
Investment Advisors Using our Service
If you are interested in basing part of your investment strategy on our service, but do not have the time, experience or confidence to do so on your own account, then consider using an investment advisor.
TradeRight Securities, located in a suburb of Chicago, is a full services investment management company and broker/dealer. They have been a subscriber, and user, of BreakoutWatch.com for some time now. They practice CANTATA and use Breakoutwatch.com as a “research analyst”.
They also provide:
• A hands-on approach through personalized service
•
On-going communication, guidance, and consultation
•
An environment that working together with their clients will help them reach
their financial goals
You can learn more about TradeRight Securities at: www.traderightsecurities.com.
If you’re interested
in speaking to a representative, simply call them toll-free at 1-800-308-3938
or e-mail gdragel@traderightsecurities.com.
Get a 14 day Trial of our premium 'Platinum' service for just $9.95 and if you subsequently subscribe to any subscription level we will credit your $9.95 to your subscription. 14
Day Platinum Trial |
| Index | Value | Change Week | Change YTD | Market1 Signal |
||||||||||||||||||||||||||||||||||||
|---|---|---|---|---|---|---|---|---|---|---|---|---|---|---|---|---|---|---|---|---|---|---|---|---|---|---|---|---|---|---|---|---|---|---|---|---|---|---|---|---|
| Dow | 10678.6 | 2.21% | -0.97% | enter | ||||||||||||||||||||||||||||||||||||
| NASDAQ | 2175.51 | 1.61% | 0% | enter | ||||||||||||||||||||||||||||||||||||
| S&P 500 | 1241.48 | 1.93% | 2.44% | enter | ||||||||||||||||||||||||||||||||||||
1The Market Signal is derived from our proprietary
market model. The market model is described on the site. 2The site also shows industry rankings based on fundamentals, combined technical and fundamentals, and on price alone (similar to IBD). The site also shows daily industry movements. |
||||||||||||||||||||||||||||||||||||||||
# of Breakouts
|
Period Average1
|
Max. Gain During Period2
|
Gain at Period Close3
|
|
|---|---|---|---|---|
| This Week | 29 | 33.62 | 4.15% | 2.25% |
| Last Week | 22 | 34.54 | 5.85% | 2.84% |
| 13 Weeks | 470 | 35.77 | 15.14% |
7.21% |
Sector
|
Industry
|
Breakout Count for Week
|
|---|---|---|
Electronics
|
Electr-Semicndtr Mfg
|
2
|
Healthcare
|
Healthcare-Products
|
2
|
Oil & Gas
|
Oil & Gas-U S Explr/Prod
|
2
|
Special
|
Special-ClsdEndFunds/Bond
|
2
|
Auto & Truck
|
Auto & Truck-OEM
|
1
|
Banks
|
Banks-Money Center
|
1
|
Building
|
Building-Painting Prds
|
1
|
Chemical
|
Chemical-Basic
|
1
|
Computer
|
Computer-Graphics
|
1
|
Computer Software
|
Comp Software-Security
|
1
|
Healthcare
|
Healthcare-Biomed/Genetic
|
1
|
Healthcare
|
Healthcare-Med/Dent Services
|
1
|
Healthcare
|
Healthcare-Outpnt/HmCare
|
1
|
Healthcare
|
Healthcare-Instruments
|
1
|
Insurance
|
Insurance-Prop/Casualty/TItl
|
1
|
Mining
|
Mining-Misc Ores
|
1
|
Mining
|
Mining-Gold/Silver/Gems
|
1
|
Oil & Gas
|
Oil & Gas-Intl Explr/Prod
|
1
|
Oil & Gas
|
Oil & Gas-Field Services
|
1
|
Personal
|
Personal -Cosmetics
|
1
|
Retail
|
Retail-Mail Order/Direct
|
1
|
Retail
|
Retail-Jewelry
|
1
|
Telecomm
|
Telecomm-Wireless Services
|
1
|
Telecomm
|
Telecomm-Services Fgn
|
1
|
Telecomm
|
Telecomm-Equipment
|
1
|
2This represents the return if each stock were bought at its breakout price and sold at its intraday high.
3This represents the return if each stock were bought at its breakout price and sold at the most recent close.
Category |
Symbol |
Company Name |
Expected Gain1 |
|---|---|---|---|
| Best Overall | UBET | YOUBET COM INC | 101 |
| Top Technical | MIX | INTERMIX MEDIA INC | 53 |
| Top Fundamental | UBET | YOUBET COM INC | 101 |
| Top Tech. & Fund. | UBET | YOUBET COM INC | 101 |
Category |
Symbol |
Company Name |
Expected Gain1 |
|---|---|---|---|
| Best Overall | BOO | COLLEGIATE PACIFIC INC | 81 |
| Top Technical | MFE | MCAFEE, INC | 49 |
| Top Fundamental | BRY | BERRY PETE CO | 37 |
| Top Tech. & Fund. | BRY | BERRY PETE CO | 37 |
If you received this newletter from a friend and you would like to receive it regularly please go to the BreakoutWatch.com site and enter as a Guest. You will then be able to register to receive the newsletter.
Copyright © 2005 NBIcharts, LLC dba BreakoutWatch.com. All rights reserved.