| Market Summary | Weekly Breakout Report | Top Breakout Choices | Top 2nd Chances | New Features | Tip of the Week |
Market Summary
Our market model reversed itself twice again this week as markets attempted to reconcile threats to the economy from inflation, interest rates and energy prices with positive news on retail sales and productivity. The dilemma resolved itself to the upside and the markets closed near their highs for the week on above average volume. The DJI gained 1.23%, the NASDAQ rose an impressive 3.81% and the S&P 500 added 1.81%. The DJI and S&P 500 broke through resistance levels at the 50 and 200 dma levels and several analysts drew attention to the all-time high reached by the Dow Jones Transportation Index, considered a leading indicator of economic activity.
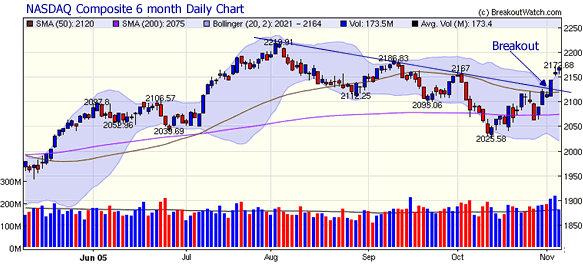
Last week we again drew attention to the descending trendline on the NASDAQ and the narrowing Bollinger Bands that could presage a breakout to either the upside or the downside. This week we saw the breakout occur to the upside and the index convincingly broke through the descending trend line and walked up the outside of the upper band. This is a bullish pattern as a close outside the upper band is a continuation signal (see A Short Discussion on Bollinger Bands).

This week saw the number of successful breakouts almost double to forty-eight for an average gain of 3.5%. PW Eagle (PWEI) made its second breakout in two weeks and has gained 27% since October 31. Hughes Supply (HUG) closed 10.5% higher following its breakout on Monday.
Be sure to read our 'Top Tip' this week to see how to improve your chances of selecting top gainers such as these. Also, note that our Backtest tool has been improved to allow analysis of successful breakouts.
Get a 14 day Trial of our premium 'Platinum' service for just $9.95 and if you subsequently subscribe to any subscription level we will credit your $9.95 to your subscription. 14
Day Platinum Trial |
Backtest Enhancements
Our Backtest tool now allows you to select a list of stocks meeting your filters and view the corresponding charts showing the cup-with-handle features and performance since breakout. Click here for an example of this powerful new feature.
T/A Charts Enhancements
Support and resistance levels were added to the T/A charts as well as cup-with-handle and double-bottom annotations of critical turning points.
New CwHwatch Metric - VADVR
See below.
This week we continue to look at new metrics we are introducing which will improve our subscriber's returns through increasing the chances of selecting successful breakouts and those most likely to make higher longer term gains.
Last week we introduced our new Price/Volume Indicator (PVI) metric. This week we introduce the Volume to Average Daily Volume Ratio (VADVR) metric as a new column under the CWH Metrics tab on CwHwatch. The VADVR is the last metric we will introduce and next week we look at how combining the three new metrics with our other data considerably improves your ability to pick successful breakouts with high gains and low chance of failure after breakout.
The VADVR considerably increases the chance of selecting a successful breakout as we will see. The following table summarizes all stocks that have appeared on our CwHwatch list since April, 2003. Each entry on the list is called a 'case'. We evaluated each case according to whether or not a breakout attempt occurred and how it was resolved. A breakout attempt is an intraday condition that occurs when a stock meets its breakout price and its projected volume will meet 1.5 times the average daily volume. We send out alerts when a breakout attempt is made and our new VADVR metric will help you determine if that alert has a chance of success. 'Success' means the breakout was confirmed; FV means it failed on volume, that is, it didn't meet the 1.5 times adv requirement; FP means it failed on price, meaning it closed below the breakout price on the day of the attempt and FB means it failed on both price and volume.
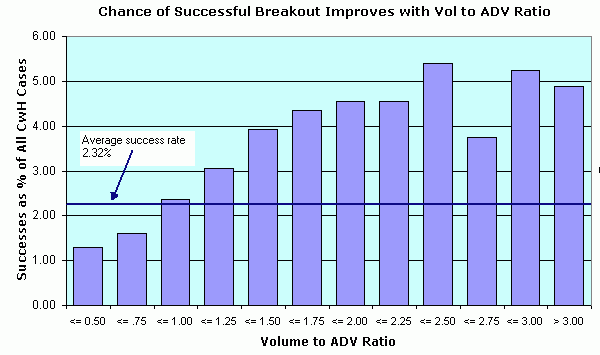
You can see that the average success rate is just 2.32% of all cases but 46.28% of all alerts. You can also see that the chance of success rises as VADVR increases.
| VADVR | No Attempt | FB | FP | FV | Success | Total Attempts | Total of Cases | % of successes | Success as % of all Cases | Success as % of Attempts |
|---|---|---|---|---|---|---|---|---|---|---|
| <= 0.50 | 21125 | 158 | 98 | 215 | 281 | 752 | 21877 | 11.90% | 1.28 | 37.37% |
| <= .75 | 27229 | 266 | 134 | 304 | 455 | 1159 | 28388 | 19.27% | 1.60 | 39.26% |
| <= 1.00 | 20941 | 216 | 146 | 240 | 523 | 1125 | 22066 | 22.15% | 2.37 | 46.49% |
| <= 1.25 | 11994 | 127 | 122 | 138 | 390 | 777 | 12771 | 16.52% | 3.05 | 50.19% |
| <= 1.50 | 6224 | 61 | 97 | 67 | 264 | 489 | 6713 | 11.18% | 3.93 | 53.99% |
| <= 1.75 | 3309 | 34 | 61 | 28 | 156 | 279 | 3588 | 6.61% | 4.35 | 55.91% |
| <= 2.00 | 1828 | 15 | 31 | 15 | 90 | 151 | 1979 | 3.81% | 4.55 | 59.60% |
| <= 2.25 | 1110 | 13 | 23 | 8 | 55 | 99 | 1209 | 2.33% | 4.55 | 55.56% |
| <= 2.50 | 689 | 3 | 18 | 8 | 41 | 70 | 759 | 1.74% | 5.40 | 58.57% |
| <= 2.75 | 515 | 3 | 14 | 7 | 21 | 45 | 560 | 0.89% | 3.75 | 46.67% |
| <= 3.00 | 326 | 1 | 10 | 6 | 19 | 36 | 362 | 0.80% | 5.25 | 52.78% |
| > 3.00 | 1230 | 8 | 36 | 10 | 66 | 120 | 1350 | 2.80% | 4.89 | 55.00% |
| Totals | 96520 | 905 | 790 | 1046 | 2361 | 5102 | 101622 | 100.00% | 2.32 | 46.28% |
This chart represents graphically how the chance of a breakout attempt for all cases increases with VADVR:

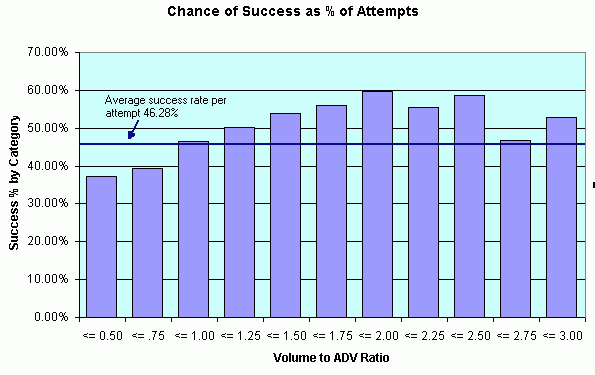
Once an alert is issued, the average chance that a breakout will occur is 46%. This chart shows the chance of any particular attempt being confirmed increases with VADVR:

Conclusion
The difference between success and failure in the markets is gained by improving the odds in our favor. We can never be 100% right but if we are right more often than we are wrong then we stand to make outstanding gains if our strategy is coupled with a sound money management policy. So if we are trying to pick successful breakouts from the alerts we receive each day, then we should pay attention to the VADVR because it can significantly improve our chances of picking a winner. To summarize, here's how the chances of picking a successful breakout on an alert improve as the VADVR increases:
| If VADR is: | Chance of Successful Breakout is: |
|---|---|
| > 0 | 46.28% |
| > 0.5 | 47.82% |
| > 0.75 | 50.92% |
| > 1.00 | 53.34% |
| > 1.25 | 55.24% |
| > 1.50 | 56.00% |
| > 1.75 | 56.05% |
| > 2.00 | 54.59% |
| > 2.25 | 54.24% |
| > 2.50 | 52.74% |
| > 2.75 | 54.49% |
| > 3.00 | 55.00% |
Investment Advisors Using our Service
If you are interested in basing part of your investment strategy on our service, but do not have the time, experience or confidence to do so on your own account, then consider using an investment advisor.
TradeRight Securities, located in a suburb of Chicago, is a full services investment management company and broker/dealer. They have been a subscriber, and user, of BreakoutWatch.com for some time now. They practice CANTATA and use Breakoutwatch.com as a “research analyst”.
They also provide:
• A hands-on approach through personalized service
•
On-going communication, guidance, and consultation
•
An environment that working together with their clients will help them reach
their financial goals
You can learn more about TradeRight Securities at: www.traderightsecurities.com. If you’re interested in speaking to a representative, simply call them toll-free at 1-800-308-3938 or e-mail gdragel@traderightsecurities.com.
Get a 14 day Trial of our premium 'Platinum' service for just $9.95 and if you subsequently subscribe to any subscription level we will credit your $9.95 to your subscription. 14
Day Platinum Trial |
| Index | Value | Change Week | Change YTD | Market1 Signal |
||||||||||||||||||||||||||||||||||||
|---|---|---|---|---|---|---|---|---|---|---|---|---|---|---|---|---|---|---|---|---|---|---|---|---|---|---|---|---|---|---|---|---|---|---|---|---|---|---|---|---|
| Dow | 10530.8 | 1.23% | -2.34% | enter | ||||||||||||||||||||||||||||||||||||
| NASDAQ | 2169.43 | 3.81% | -0.28% | enter | ||||||||||||||||||||||||||||||||||||
| S&P 500 | 1220.14 | 1.81% | 0.68% | enter | ||||||||||||||||||||||||||||||||||||
1The Market Signal is derived from our proprietary
market model. The market model is described on the site. 2The site also shows industry rankings based on fundamentals, combined technical and fundamentals, and on price alone (similar to IBD). The site also shows daily industry movements. |
||||||||||||||||||||||||||||||||||||||||
# of Breakouts
|
Period Average1
|
Max. Gain During Period2
|
Gain at Period Close3
|
|
|---|---|---|---|---|
| This Week | 38 | 24.15 | 6.36% | 3.51% |
| Last Week | 21 | 24.69 | 8.81% | 5.97% |
| 13 Weeks | 389 | 27.46 | 10.09% |
1.16% |
Sector
|
Industry
|
Breakout Count for Week
|
|---|---|---|
Insurance
|
Insurance-Diversified
|
2
|
Insurance
|
Insurance-Prop/Casualty/TItl
|
2
|
Telecomm
|
Telecomm-Services Fgn
|
2
|
Banks
|
Banks-Foreign
|
1
|
Banks
|
Banks-Southeast
|
1
|
Beverages
|
Beverages-Alcoholic
|
1
|
Building
|
Building-A/C Heating Pds
|
1
|
Business Services
|
Business Svcs-Sec/Safety
|
1
|
Business Services
|
Business Svcs-Staffing
|
1
|
Chemical
|
Chemical-Plastics
|
1
|
Computer
|
Computer-Services
|
1
|
Computer
|
Computer-Networking
|
1
|
Computer Software
|
Comp Software-Enterprise
|
1
|
Diversified Operations
|
Diversified Operations
|
1
|
Electronics
|
Electr-Semicndtr Mfg
|
1
|
Electronics
|
Electr-Parts Distrib
|
1
|
Electronics
|
Electr-Misc Products
|
1
|
Finance
|
Finance-Invest Management
|
1
|
Finance
|
Finance-Brokers
|
1
|
Healthcare
|
Healthcare-Instruments
|
1
|
Healthcare
|
Healthcare-Drugs/Generic
|
1
|
Healthcare
|
Healthcare-HMO
|
1
|
Healthcare
|
Healthcare-Products
|
1
|
Healthcare
|
Healthcare-Med/Dent Services
|
1
|
Machinery
|
Machinery-Machine Tools
|
1
|
Media
|
Media-Diversified
|
1
|
Metal Prds
|
Metal Prds-Pipe/Fab/Misc
|
1
|
Retail
|
Retail-Apparel
|
1
|
Retail
|
Retail-Building Products
|
1
|
Telecomm
|
Telecomm-Wireless Services
|
1
|
Textile
|
Textile-Apparel Mfg
|
1
|
Transportation
|
Transportation-Truck
|
1
|
Transportation
|
Transportation -Airlines
|
1
|
Transportation
|
Transportation-Services
|
1
|
2This represents the return if each stock were bought at its breakout price and sold at its intraday high.
3This represents the return if each stock were bought at its breakout price and sold at the most recent close.
Category |
Symbol |
Company Name |
Expected Gain1 |
|---|---|---|---|
| Best Overall | EMBT | EMBARCADERO TECHNOLOGIES INC | 82 |
| Top Technical | CPTV | CAPTIVA SOFTWARE CORP DEL | 32 |
| Top Fundamental | ZNT | ZENITH NATL INS CORP | 17 |
| Top Tech. & Fund. | ZNT | ZENITH NATL INS CORP | 17 |
Category |
Symbol |
Company Name |
Expected Gain1 |
|---|---|---|---|
| Best Overall | LAB | LABRANCHE & CO INC | 41 |
| Top Technical | RVSN | RADVISION LTD | 0 |
| Top Fundamental | ASPM | ASPECT MED SYS INC | 15 |
| Top Tech. & Fund. | ASPM | ASPECT MED SYS INC | 15 |
If you received this newletter from a friend and you would like to receive it regularly please go to the BreakoutWatch.com site and enter as a Guest. You will then be able to register to receive the newsletter.
Copyright © 2005 NBIcharts, LLC dba BreakoutWatch.com. All rights reserved.