| Market Summary | Weekly Breakout Report | Top Breakout Choices | Top 2nd Chances | New Features | Tip of the Week |
New TradeWatch service - BUY AT OPEN - see this weeks Top Tip
Market Summary
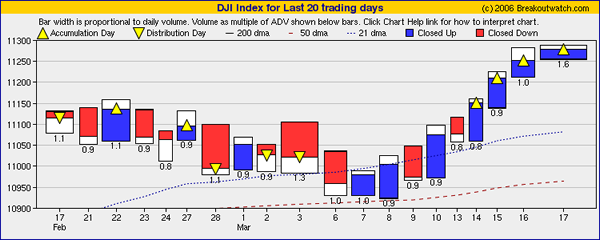
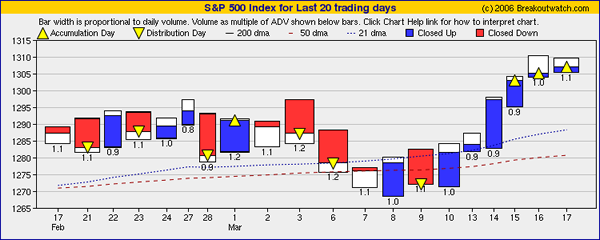
The major indexes made healthy gains of around 2% this week as economic data showed that inflation was under control, upward pressure on wages was low, housing sales increased in February, Treasury yields retreated and crude oil prices fell. The S&P 500 was the biggest beneficiary of the bullish sentiment with a gain of 2% while the NASDAQ Composite followed up with a 1.96% rise and the DJI rose 1.84%. For now, the market seems to have put aside its fears that rising interest rates will threaten corporate profits, but any event that shakes this complacency will provide an excuse for profit taking. We may well see profit taking early next week, in any case, as the S&P has had six consecutive days of gains and the Dow four consecutive days of gains. Our market analysis charts, published each day, show how healthy the gains in these two indexes have been with strong accumulation on both indexes (although Friday's volume must be partly discounted due it being a quadruple witching day).
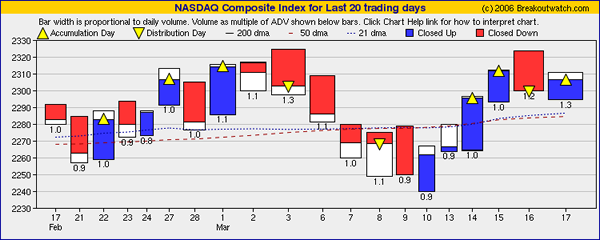
The NASDAQ advanced with less certainty as concerns about Google and technology stocks in general weigh on that index. It failed to pierce its most recent resistance level and reversed on Thursday.
The number of breakouts rose to 36 this week with average gains for the week of 7.7%. DXP Enterprises (DXPE) was the standout performer with a 16% gain over its pivot. DXPE was also on our TradeWatch Day Trade list where we suggest stocks that have a strong potential to breakout and it gained 12.8% over our suggested buy-stop on the day.
Get a 14 day Trial of our premium 'Platinum' service for just $9.95 and if you subsequently subscribe to any subscription level we will credit your $9.95 to your subscription. 14
Day Platinum Trial |
Sell Assistant Update
A new version of our Sell Model, which is the engine behind the Sell Assistant, was put into production on Wednesday. The new version was developed following insights gained while using the Sell Model in connection with expected gains of more than 75% as reported in recent newsletters.
As you can see from the table below, the new model gives an extra 1.5% gain per position before signaling a sell. That's a 16% improvement. The hold time to get the extra return is a little longer, but the annualized return is improved. The improved results are obtained by recognizing that on average lower priced stocks give better returns and allowing them more volatility before signaling a sell. The model also allows a pullback to the handle low in the early stages of a breakout, which is the secondary support level after the pivot. (The pivot is a resistance level before breakout and a support level after breakout). If you are using the Sell Assistant on a non-breakout stock, for which there is no handle low, then the equivalent support level is the PSAR value on the buy date.
When backtested against the TradeWatch Best Return list, the new model gives the following improvements over the prior model as of 3/14/06 (check the TradeWatch History for the latest statistics):
Performance Measure
|
Prior Model
|
New Model
|
|---|---|---|
No. of Positions Open:
|
8
|
11
|
Avg. % Gain on Open Positions:
|
7.51
|
10.16
|
No. of Positions Closed:
|
78
|
75
|
Avg. % Gain on Closed Positions:
|
9.09
|
10.62
|
Avg. Hold Period:
|
50 days
|
55 days
|
Annualized Return:
|
65%
|
70%
|
We have had some inconsistencies between Sell Alerts and the Sell Assistant results display but we hope these are all resolved with this new version of the Sell Model. Please consider this to be on beta-test until March 31 and let us know of any inconsistencies in sell alerts that you might receive. Thank you.
New TradeWatch list - 'Buy at Open'
This list is based on stocks that brokeout from the most recent CwHwatch list and have an expected gain of at least 75%. There is more on this below.
New TradeWatch List - Buy at Open
To allow our TradeWatch subscribers to more easily profit from the exceptional returns possible when buying after breakout when the expected gain is at least 75%, we have added a new list to TradeWatch called 'Buy at Open'. This list is compiled from stocks that broke out from the most recent watchlist and have an expected gain of at least 75% as calculated by our Expected Gain model. This model uses the ratio of breakout day volume to the 50 day average volume to improve the expected gain over that which can be calculated before breakout. The list shows the breakout price and suggested buy stop of 5% over the breakout price. The rationale for providing this list was presented in our two most recent newsletters which are available in the archive.
The new list is accessed from the navigation bar by clicking TradeWatch and then from the TradeWatch menu. The history of how this strategy would have performed over the last year is available under the TradeWatch History menu and charts of the performance of these stocks when linked to our Sell Assistant is available by clicking the symbol in the history list. Remember that our backtest results are obtained using no sell stop, so to replicate our results, you might need to set the sell stop to 99 after the chart displays and then display the chart again.
As the TradeWatch history is normally accessible only to TradeWatch members, there is a non-secured version of the list with links to annotated charts showing sell points given by our sell model here.
You will notice that the returns on any individual position are considerably higher than under the 'Best Return' strategy while it takes longer on average before the Sell Model issues a sell signal so the overall annualized returns can be slightly lower. Since most of you will buy individual positions, rather than the complete 'portfolio', it is the return per position that is most interesting.
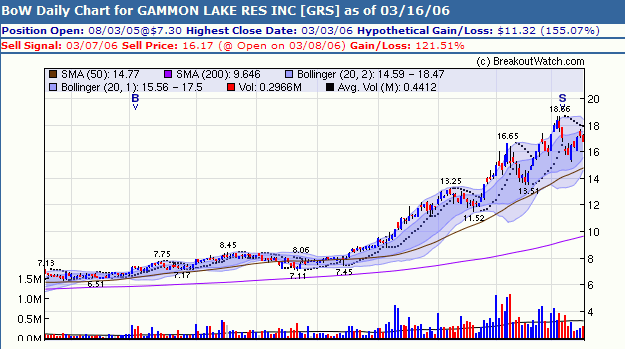
As you look through the history, you will see that some of the returns given using the Sell Model are quite close to the maximum possible. For example, if you had bought GRS and held on until our sell model said sell, you would have realized a 121% gain.
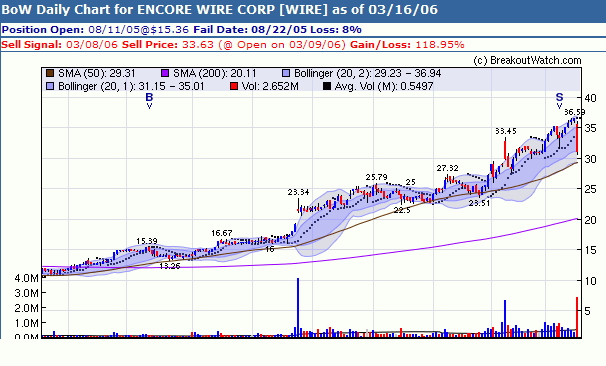
If you had bought WIRE on 8/11/05 and used the standard 8% stop loss, you would have been stopped out eleven days later. However, if you had used our sell model, you would have sold on March 9, 2006 and realized a gain of 119%. Note that the model would have taken you out of the position just before a 13% drop on March 16.
To discuss this new strategy, please post your comments to the Breakoutwatch Strategies Forum. The forums are open to non-subscribers.
If you think our service has great potential but you are too busy, or lack the technical analysis skills to apply our methods, you should consider talking to one of the investment advisors listed below.
Investment Advisors Using our Service
TradeRight Securities, located in a suburb of Chicago, is a full services investment management company and broker/dealer. They have been a subscriber, and user, of BreakoutWatch.com for some time now. They practice CANTATA and use Breakoutwatch.com as a “research analyst”. You can learn more about TradeRight Securities at: www.traderightsecurities.com. If you’re interested in speaking to a representative, simply call them toll-free at 1-800-308-3938 or e-mail gdragel@traderightsecurities.com.
PivotPoint Advisors, LLC takes a technical approach to investment planning and management. A breakoutwatch.com subscriber since May, 2004, they use breakouts, market signals, and now TradeWatch to enhance returns for their clients. Learn more at http://pivotpointadvisors.net or contact John Norquay at 608-826-0840 or by email at john.norquay@pivotpointadvisors.net.
Note to advisors: If you would like to be listed here, please contact us. As a service to those who support us, there is no additional charge to be listed here.
Get a 14 day Trial of our premium 'Platinum' service for just $9.95 and if you subsequently subscribe to any subscription level we will credit your $9.95 to your subscription. 14
Day Platinum Trial |
| Index | Value | Change Week | Change YTD | Market1 Signal |
||||||||||||||||||||||||||||||||||||
|---|---|---|---|---|---|---|---|---|---|---|---|---|---|---|---|---|---|---|---|---|---|---|---|---|---|---|---|---|---|---|---|---|---|---|---|---|---|---|---|---|
| Dow | 11279.7 | 1.84% | 5.25% | enter | ||||||||||||||||||||||||||||||||||||
| NASDAQ | 2306.48 | 1.96% | 4.59% | enter | ||||||||||||||||||||||||||||||||||||
| S&P 500 | 1307.25 | 2% | 4.72% | enter | ||||||||||||||||||||||||||||||||||||
1The Market Signal is derived from our proprietary
market model. The market model is described on the site. 2The site also shows industry rankings based on fundamentals, combined technical and fundamentals, and on price alone (similar to IBD). The site also shows daily industry movements. |
||||||||||||||||||||||||||||||||||||||||
# of Breakouts
|
Period Average1
|
Max. Gain During Period2
|
Gain at Period Close3
|
|
|---|---|---|---|---|
| This Week | 36 | 32.31 | 5.65% | 7.68% |
| Last Week | 23 | 32.31 | 7.33% | 4.1% |
| 13 Weeks | 481 | 34.46 | 14.21% |
5.62% |
Sector
|
Industry
|
Breakout Count for Week
|
|---|---|---|
Healthcare
|
Healthcare-Biomed/Genetic
|
4
|
Electronics
|
Electr-Semicndtr Mfg
|
3
|
Building
|
Building-Cement Etc.
|
2
|
Computer Software
|
Comp Software-Enterprise
|
2
|
Banks
|
Banks-Super Regional
|
1
|
Banks
|
Banks-Northeast
|
1
|
Building
|
Building-Heavy Constr
|
1
|
Business Services
|
Business Svcs-Sec/Safety
|
1
|
Business Services
|
Business Svcs-Misc
|
1
|
Computer
|
Computer-Peripheral Equip
|
1
|
Electronics
|
Electr-Semicndtr Equip
|
1
|
Food
|
Food-Prepared
|
1
|
Healthcare
|
Healthcare-Med/Dent Supply
|
1
|
Insurance
|
Insurance-Diversified
|
1
|
Internet
|
Internet-ISP/Content
|
1
|
Machinery
|
Machinery-Industrial
|
1
|
Metal Prds
|
Metal Prds-Pipe/Fab/Misc
|
1
|
Pollution Control
|
Pollution Control-Equip
|
1
|
Pollution Control
|
Pollution Control-Services
|
1
|
Real Estate/ REIT
|
Real Estate Management
|
1
|
Real Estate/ REIT
|
Real Estate-REIT
|
1
|
Retail
|
Retail-Building Products
|
1
|
Retail
|
Retail-Misc/Diversified
|
1
|
Retail
|
Retail-Home Furnishings
|
1
|
Retail
|
Retail-Apparel
|
1
|
Special
|
Special-ClsdEndFunds/Bond
|
1
|
Steel
|
Steel -Producers
|
1
|
Telecomm
|
Telecomm-Equipment
|
1
|
Transportation
|
Transportation-Air Frght
|
1
|
2This represents the return if each stock were bought at its breakout price and sold at its intraday high.
3This represents the return if each stock were bought at its breakout price and sold at the most recent close.
Category |
Symbol |
Company Name |
Expected Gain1 |
|---|---|---|---|
| Best Overall | HOM | Home Solutions Of America | 105 |
| Top Technical | OYOG | Oyo Geospace Corp | 36 |
| Top Fundamental | IFIN | Investors Fin Svcs Cp | 22 |
| Top Tech. & Fund. | BOT | CBOT Holdings Inc | 28 |
Category |
Symbol |
Company Name |
Expected Gain1 |
|---|---|---|---|
| Best Overall | EMIS | Emisphere Technologies | 98 |
| Top Technical | GAIA | Gaiam Incorporated Cl A | 59 |
| Top Fundamental | MCO | Moody's Corporation | 29 |
| Top Tech. & Fund. | MCO | Moody's Corporation | 29 |
If you received this newletter from a friend and you would like to receive it regularly please go to the BreakoutWatch.com site and enter as a Guest. You will then be able to register to receive the newsletter.
Copyright © 2006 NBIcharts, LLC dba BreakoutWatch.com. All rights reserved.