| Market Summary | Weekly Breakout Report | Top Breakout Choices | Top 2nd Chances | New Features | Tip of the Week |
Now is the time to find high quality stocks that were in an uptrend before the recent correction. Learn how and get ten picks in our top tip this week.
Market Summary
On Thursday, the twelfth day of the rally that began on June 14, the markets delivered an unequivocal follow-through day (FTD) with gains of 2-3% and substantial volume. The reason was a clear moderation of the hawkish tone on interest rates from the FOMC, as they raised rates by the expected 0.25% but said that while inflation risks remain they would consider prospects for economic growth before acting further. This was a huge relief to investors concerned that the Fed's exclusive focus on fighting inflation would drive the economy into recession. Friday coincided with the end of the month and the markets suffered a distribution day as money managers adjusted their portfolios to lock in Thursday's gains and accommodate the reconstitution of the Russell 3000 index. Although Friday's volume was large, losses were small. For the week, the DJI gained 1.47%, the NASDAQ added 2.39% and the S&P 500 rose 2.06%. The NASDAQ remains in deficit for the year, while the Dow has gained 4% and the S&P 500 1.75%.
We would have liked to see the FTD come sooner but there were special circumstances in play here as the markets were nervously awaiting the outcome of the FOMC meeting. Although the FTD can be taken as a confirmation of the rally, the NASDAQ remains below its 200 day moving average and our market model remains at exit for this market. Our analysis of the behavior of the NASDAQ since its inception in 1984 showed that follow-through days could not be trusted unless the index was above its 200 dma, so we believe that we are not yet out of the woods and careful stock selection is still in order. The NASDAQ was driven down further than the other indexes recently, and as we show in this week's top tip, has lagged in the recovery despite being the biggest gainer this week.
The number of breakouts increased significantly to thirty-seven this week and had gained an average of 4.5% above their pivots by Friday's close. Takeover candidate RSA Security (RSA) broke out on Thursday with a gain of 21% and gained 39.1% by week's end. Other big breakouts were GRB (12.8%), WebMD (WBMD), 12.3%, AEA (9.7%), OGE (9.6%) and Columbia Banking System (COLB), 8.82%. In all, twelve of the thirty-seven breakouts closed above the 5% out-of-range limit.
| Get a 14 day Trial of
our premium 'Platinum' service and TradeWatch for just $9.95 and
if you subsequently subscribe to any subscription
level we will credit your $9.95 to your subscription.
14
Day Platinum Trial |
There were no new features added this week.
Stocks Rebuilding Bases after the Recent Decline
Thursday's strong follow-through day indicated that a new market rally could be under way. This is the ideal time to search out stocks that could benefit the most from a possible new rally. These are likely to be stocks that were already in an uptrend before the market decline and were hurt by the overall correction, but are now ready to resume their upwards trend. This week we look at how to find these stocks using the powerful base analysis tools our site offers.
The first thing to do is to look for stocks that began their decline after the correction started. The NASDAQ was the first to break-down after setting an intra-day high on April 20, which was 51 trading sessions ago. (as of 1/1/07 - you'll need to adjust that number if you are applying these techniques later). This is plenty of time to form a valid cup-style base so we should search for stocks with a cup length of 51 days or less.
Secondly, we want stocks that have out-performed the market, even though they may have declined considerably as they formed their new base. This is easily done by searching for stocks with a high RS Rank. Additionally, you may want to look for stocks that have recovered from the bottom of their base by a greater percentage than the market indexes. The following table shows the degree of retracement for each major index.
Index |
High |
Low |
Last |
Retracement |
|---|---|---|---|---|
NASDAQ |
2375.5 |
2065.11 |
2172.09 |
34% |
DJI |
11670.2 |
10698.8 |
11150.2 |
46% |
S&P 500 |
1326.7 |
1219.3 |
1270.2 |
47% |
Put simply, this means that we are searching for 3-character symbols with a retracement of more than 46%, and 4-character (or more) symbols with a retracement of more than 34%.
Thirdly, you may want to look for stocks that are leaders in leading industries. Our research shows that this is only weakly correlated with successful breakouts compared to the importance of RS Rank.
Our cup-with-handle and double-bottom watchlists provide easy ways of finding stocks that provide a valid entry-point and meet these criteria. To catch other stocks that do not qualify for these chart patterns, but may still meet the criteria, then our BaseWatch tool is the way to go. Incidentally, because stocks in the CwH and DB patterns are all sub-sets of BaseWatch, we can do all the work we need to do using that tool. Now we will show you how.
1. Select Mine for Candidates > BaseWatch
2. The BaseWatch tool will open in a new window. You may need to maximize the window, and also note that there could be an outer set of scroll bars on they browser window, and an inner set of scroll bars on the BaseWatch tool to accommodate all the data.
3. Click the Show Filters button
4. Now enter our filter values as follows (Industry Rank is further to the right than shown in this image). We've added a volume filter to meet minimum volume guidelines.

5. Click the Apply Filters button
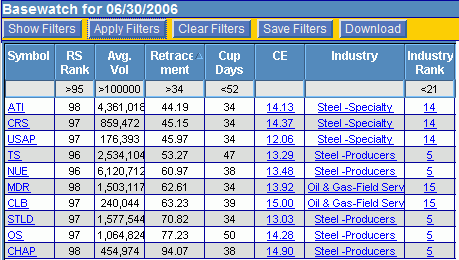
The display will refresh and you can now sort it by clicking on any of the column headings. Sorting retracement from low to high will sort by those being lowest in their base. (These may offer the best short term returns if they return to their former high). The following image shows the relevant columns as of 6/30/06. Note that they all have quite high CANTATA Evaluator (CE) scores.

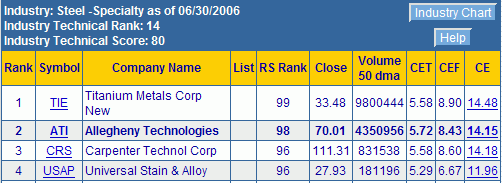
We now have a list of stocks meeting our criteria and worthy of further due diligence. Begin by clicking the industry name which will show the rank of each stock within the industry as follows. We see that the three Steel-Specialty stocks rank 2, 3 and 4 in the group, so they are among the leaders. (TIE did not make the cut because its retracement level was just 29%).

Conclusion
The above is an example of how to use our BaseWatch service to find stocks building their bases at this time. You can, of course, adjust the filter parameters to meet your own needs.
Investment Advisors Using our Service
TradeRight Securities, located in a suburb of Chicago, is a full services investment management company and broker/dealer. They have been a subscriber, and user, of BreakoutWatch.com for some time now. They practice CANTATA and use Breakoutwatch.com as a “research analyst”. You can learn more about TradeRight Securities at: www.traderightsecurities.com. If you’re interested in speaking to a representative, simply call them toll-free at 1-800-308-3938 or e-mail gdragel@traderightsecurities.com.
PivotPoint Advisors, LLC takes a technical approach to investment planning and management. A breakoutwatch.com subscriber since May, 2004, they use breakouts, market signals, and now TradeWatch to enhance returns for their clients. Learn more at http://pivotpointadvisors.net or contact John Norquay at 608-826-0840 or by email at john.norquay@pivotpointadvisors.net.
Note to advisors: If you would like to be listed here, please contact us. As a service to those who subscribe to us, there is no additional charge to be listed here.
| Get a 14 day Trial of
our premium 'Platinum' service and TradeWatch for just $9.95 and
if you subsequently subscribe to any subscription
level we will credit your $9.95 to your subscription.
14
Day Platinum Trial |
| Index | Value | Change Week | Change YTD | Market1 Signal |
||||||||||||||||||||||||||||||||||||
|---|---|---|---|---|---|---|---|---|---|---|---|---|---|---|---|---|---|---|---|---|---|---|---|---|---|---|---|---|---|---|---|---|---|---|---|---|---|---|---|---|
| Dow | 11150.2 | 1.47% | 4.04% | enter | ||||||||||||||||||||||||||||||||||||
| NASDAQ | 2172.09 | 2.39% | -1.51% | exit | ||||||||||||||||||||||||||||||||||||
| S&P 500 | 1270.19 | 2.06% | 1.75% | enter | ||||||||||||||||||||||||||||||||||||
1The Market Signal is derived from our proprietary
market model. The market model is described on the site. 2The site also shows industry rankings based on fundamentals, combined technical and fundamentals, and on price alone (similar to IBD). The site also shows daily industry movements. |
||||||||||||||||||||||||||||||||||||||||
# of Breakouts
|
Period Average1
|
Max. Gain During Period2
|
Gain at Period Close3
|
|
|---|---|---|---|---|
| This Week | 37 | 17.69 | 5.94% | 4.62% |
| Last Week | 15 | 19.31 | 4.67% | 3.21% |
| 13 Weeks | 299 | 21.15 | 10.44% |
-1.85% |
Sector
|
Industry
|
Breakout Count for Week
|
|---|---|---|
Banks
|
Banks-West/Southwest
|
4
|
Real Estate/ REIT
|
Real Estate-REIT
|
3
|
Banks
|
Banks-Southeast
|
2
|
Finance
|
Finance-Savings&Loan
|
2
|
Healthcare
|
Healthcare-Drugs/Ethical
|
2
|
Transportation
|
Transportation -Airlines
|
2
|
Utility
|
Utility-Electric
|
2
|
Beverages
|
Beverages-Alcoholic
|
1
|
Business Services
|
Business Svcs-Leasing
|
1
|
Computer
|
Computer-Makers
|
1
|
Computer Software
|
Comp Software-Financial
|
1
|
Computer Software
|
Comp Software-Security
|
1
|
Diversified Operations
|
Diversified Operations
|
1
|
Electronics
|
Electr-Semicndtr Equip
|
1
|
Insurance
|
Insurance-Prop/Casualty/TItl
|
1
|
Internet
|
Internet-ISP/Content
|
1
|
Leisure
|
Leisure-Gaming
|
1
|
Machinery
|
Machinery-Matl Hdlg/Autom
|
1
|
Media
|
Media-Periodicals
|
1
|
Metal Prds
|
Metal Prds-Pipe/Fab/Misc
|
1
|
Oil & Gas
|
Oil & Gas-Field Services
|
1
|
Retail
|
Retail-Misc/Diversified
|
1
|
Retail
|
Retail-Apparel
|
1
|
Special
|
Special-Market/Tracking Funds
|
1
|
Telecomm
|
Telecomm-Equipment
|
1
|
Textile
|
Textile-Apparel Mfg
|
1
|
Transportation
|
Transportation-Truck
|
1
|
2This represents the return if each stock were bought at its breakout price and sold at its intraday high.
3This represents the return if each stock were bought at its breakout price and sold at the most recent close.
Category |
Symbol |
Company Name |
Expected Gain1 |
|---|---|---|---|
| Best Overall | CANI | Carreker Corporation | 98 |
| Top Technical | SMDI | Sirenza Microdevices | 67 |
| Top Fundamental | SMDI | Sirenza Microdevices | 67 |
| Top Tech. & Fund. | SMDI | Sirenza Microdevices | 67 |
Category |
Symbol |
Company Name |
Expected Gain1 |
|---|---|---|---|
| Best Overall | CANI | Carreker Corporation | 103 |
| Top Technical | CRAYD | 64 | |
| Top Fundamental | EZPW | Ezcorp Inc Cl A | 57 |
| Top Tech. & Fund. | ODFL | Old Dominion Freight Lne | 34 |
If you received this newletter from a friend and you would like to receive it regularly please go to the BreakoutWatch.com site and enter as a Guest. You will then be able to register to receive the newsletter.
Copyright © 2006 NBIcharts, LLC dba BreakoutWatch.com. All rights reserved.
" BreakoutWatch," the BreakoutWatch.com "eye" logo, and the slogan "tomorrow's breakouts today" are service marks of NBIcharts LLC. All other marks are the property of their respective owners, and are used for descriptive purposes only.