| Market Summary | Weekly Breakout Report | Top Breakout Choices | Top 2nd Chances | New Features | Tip of the Week |
New chart pattern introduced this week: Head and Shoulders - see this week's Top Tip.
Market Summary
Considering the geopolitical situation, this could be considered a good week for the markets, although the week certainly did not end well. The DJI gained 1.2% and the S&P 500 squeaked out a 0.33% rise. The NASDAQ's woes continue, however, and the tech heavy index lost a further 0.83%. Volume increased allowing the DJI and S&P 500 to register accumulation, while the NASDAQ was again under distribution.
The markets showed promise of having turned the corner on Tuesday as the NASDAQ recovered from its low of the year, while the DJI and S&P 500 found support at the levels seen back on June 14. Hopes that this promise would be fulfilled were raised on Wednesday as Fed Chairman Bernanke showed that he was aware of the fine line the Fed was walking between fighting inflation and supporting a slowing economy and investors moved the markets higher by around 2%. Profit taking cut into the gains on Thursday and earnings concerns among technology stocks, combined with a slight increase in oil prices, dragged the markets lower on Friday. Stocks did recover late in Friday's session and Tuesday's lows were not reached so the tentative rally remains intact, although only by a hair's breadth in the case of the NASDAQ.
The number of successful breakouts doubled this week although average gains were a modest 0.06% by week's close with 5 closing above the 5% out-of-range level and three making intraday double digit gains.
The biggest gains continue to made through shorting our breakdown alerts and we are introducing a new Head and Shoulders pattern recognition algorithm this week. It is described in our Top Tip this week. Charts selected through this algorithm are available to all newsletter subscribers while the pattern is on beta test, at least through to July 31.
| Get a 14 day Trial of
our premium 'Platinum' service and TradeWatch for just $9.95 and
if you subsequently subscribe to any subscription
level we will credit your $9.95 to your subscription.
14
Day Platinum Trial |
See our Top Tip below.
Head and Shoulders Chart Pattern Beta Test
The head and shoulders pattern is recognized as one of the most reliable trend reversal patterns. It forms after an uptrend and is characterized by three peaks with the center peak higher than the two adjoining peaks. A neckline is a line drawn between the two lows between the peaks. The pattern is completed and a breakdown occurs when the price falls below the extended neckline. Bulkowski* reports that 93% of these patterns continue to move downwards once a breakdown occurs with an average decline of 15%.
We have developed an algorithm to recognize head and shoulders patterns and are making it available today from a new menu choice on our site: Mine for Candidates > H&Swatch. It is available to all subscribers, newsletter readers and site guests. Over the coming week, this pattern will be integrated with the ShortSalewatch processing and we hope to be able to start sending breakdown alerts based on this pattern beginning July 31. We hope to publish our own backtested performance results for this pattern in next week's newsletter.
We recognize two types of head and shoulder, depending on the slope of the neckline. We do this so we can recognize a breakdown price and issue alerts when this price is met.
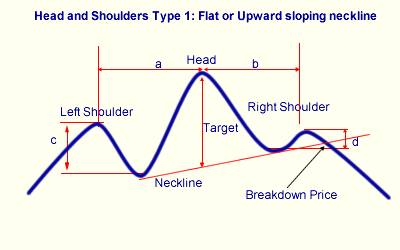
When the neckline slopes upwards, the breakdown price is calculated as the point where the neckline intersects the price line following formation of the right shoulder. It is at this point that the pattern is completed and a long position should be closed, or a short position opened. At this time we can calculate a 'target' decline which is the distance between the center peak's high and the neckline. Bulkowski* estimates this target is reached 63% of the time.
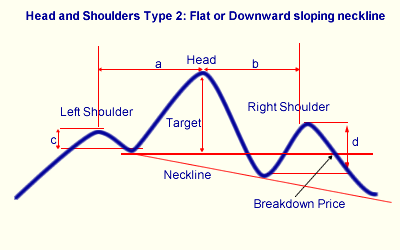
If the neckline slopes down, then it is possible that it will never intersect the price line following the right shoulder, so we use an alternative method of determining a breakdown price. In this case we use the support level between the left shoulder and the head and calculate the target price as the difference between that support level and the center peak's high.
Pattern Recognition
Our algorithm will recognize a head and shoulders pattern when the following conditions are met.
- The stock must be in a confirmed up trend before the pattern begins. An uptrend exists if the the left shoulder is at least 30% higher than the low in the previous 6 months (120 trading days).
- The pattern width, shoulder-to-shoulder, must be 6 months (120 trading days) or less.
- The head must have occurred within the last 6 months (120 trading days).
- There must be approximate symmetry to the pattern. We determine this by requiring that number days between the shoulders and the head (a and b in the diagram) must be within 50% of each other.
- There must be a noticeable trough between the left shoulder and the head (c). We chose an arbitrary minimum of 2%. This is measured from the left shoulder intraday high to the intraday high at the left neckline.
- There must be a noticeable trough between the head and the right shoulder (d). We chose an arbitrary minimum of 2%. This is measured from the right shoulder intraday high to the intraday high at the right neckline.
- For upward sloping necklines, the breakdown price is the the neckline value on the date of the last close.
- For flat or downward sloping necklines, the breakdown price is the value of the intraday low at the left neckline.
- The last close must be above the breakdown price.
- The minimum 50 day average volume must be at least 500,000. Stocks with greater liquidity are less likely to make sudden moves creating a short squeeze.
Examples
When we detect a head and shoulders pattern we will display an annotated chart clearly showing the head, shoulders, neckline, breakdown price and target price. If the neckline slopes downwards, we also show a horizontal line drawn from the left shoulder. An example of each chart type follows.
Type 1. Commerce Bancorp (CBH) formed a head and shoulders with upward sloping neckline between April and early June. The difference between the neckline and the head was 4.43. The neckline was intercepted at 37.12 on June 13 giving a target decline from the breakdown price of 32.69 or 11.93%. A short trade could have been opened on June 13 at 37.12 and covered at the target price on July 7.
Type 2. Google (GOOG) formed a head and shoulders between December 2005 and January 2006. The neckline slope was negative so the breakdown price was equal to the left shoulder at 413.74. The target decline was the difference between the left shoulder and the head price of 475.11 subtracted from the breakdown price giving 352. The price gapped down below the breakdown price on February 1 and a short position could have been opened at about 390. It dropped to 337.83 before recovering to the target price at which the position could have been closed for a gain of 10.8%.
Opening and Closing Short Positions based on Head and Shoulders Patterns
The two examples given above are for the purposes of illustrating the patterns and our chart presentations only. While a short position can be opened as described the point at which to cover is not as simple as waiting for the target price to be reached. We'll discuss the cover strategy in more detail next week.
As always, we welcome your comments and suggestions. Please post them to the Breakoutwatch Forum.
Investment Advisors Using our Service
TradeRight Securities, located in a suburb of Chicago, is a full services investment management company and broker/dealer. They have been a subscriber, and user, of BreakoutWatch.com for some time now. They practice CANTATA and use Breakoutwatch.com as a “research analyst”. You can learn more about TradeRight Securities at: www.traderightsecurities.com. If you’re interested in speaking to a representative, simply call them toll-free at 1-800-308-3938 or e-mail gdragel@traderightsecurities.com.
PivotPoint Advisors, LLC takes a technical approach to investment planning and management. A breakoutwatch.com subscriber since May, 2004, they use breakouts, market signals, and now TradeWatch to enhance returns for their clients. Learn more at http://pivotpointadvisors.net or contact John Norquay at 608-826-0840 or by email at john.norquay@pivotpointadvisors.net.
Note to advisors: If you would like to be listed here, please contact us. As a service to those who subscribe to us, there is no additional charge to be listed here.
| Get a 14 day Trial of
our premium 'Platinum' service and TradeWatch for just $9.95 and
if you subsequently subscribe to any subscription
level we will credit your $9.95 to your subscription.
14
Day Platinum Trial |
| Index | Value | Change Week | Change YTD | Market1 Signal |
||||||||||||||||||||||||||||||||||||
|---|---|---|---|---|---|---|---|---|---|---|---|---|---|---|---|---|---|---|---|---|---|---|---|---|---|---|---|---|---|---|---|---|---|---|---|---|---|---|---|---|
| Dow | 10868.4 | 1.2% | 1.41% | enter | ||||||||||||||||||||||||||||||||||||
| NASDAQ | 2020.39 | -0.83% | -8.39% | exit | ||||||||||||||||||||||||||||||||||||
| S&P 500 | 1240.29 | 0.33% | -0.64% | enter | ||||||||||||||||||||||||||||||||||||
1The Market Signal is derived from our proprietary
market model. The market model is described on the site. 2The site also shows industry rankings based on fundamentals, combined technical and fundamentals, and on price alone (similar to IBD). The site also shows daily industry movements. |
||||||||||||||||||||||||||||||||||||||||
# of Breakouts
|
Period Average1
|
Max. Gain During Period2
|
Gain at Period Close3
|
|
|---|---|---|---|---|
| This Week | 33 | 15.92 | 3.94% | 0.06% |
| Last Week | 16 | 17.38 | 5.09% | -2.48% |
| 13 Weeks | 265 | 19.62 | 7.43% |
-5.12% |
Sector
|
Industry
|
Breakout Count for Week
|
|---|---|---|
Banks
|
Banks-Southeast
|
4
|
Banks
|
Banks-Northeast
|
2
|
Healthcare
|
Healthcare-Products
|
2
|
Healthcare
|
Healthcare-Med/Dent Services
|
2
|
Real Estate/ REIT
|
Real Estate-REIT
|
2
|
Special
|
Special-Market/Tracking Funds
|
2
|
Agricultural Operations
|
Agricultural Operations
|
1
|
Banks
|
Banks-Super Regional
|
1
|
Banks
|
Banks-Money Center
|
1
|
Chemical
|
Chemical-Specialty
|
1
|
Computer
|
Computer-Storage Devices
|
1
|
Computer
|
Computer-Services
|
1
|
Finance
|
Finance-Consumer Loans
|
1
|
Finance
|
Finance-Savings&Loan
|
1
|
Healthcare
|
Healthcare-Biomed/Genetic
|
1
|
Healthcare
|
Healthcare-Drugs/Diversified
|
1
|
Insurance
|
Insurance-Prop/Casualty/TItl
|
1
|
Internet
|
Internet-ISP/Content
|
1
|
Media
|
Media-Periodicals
|
1
|
Media
|
Media-Cable/Satellite TV
|
1
|
Oil & Gas
|
Oil & Gas-Prod/Pipeline
|
1
|
Oil & Gas
|
Oil & Gas-Cdn Expl/Prd
|
1
|
Real Estate/ REIT
|
Real Estate Management
|
1
|
Special
|
Special-ClsdEndFunds/Bond
|
1
|
Utility
|
Utility-Gas
|
1
|
2This represents the return if each stock were bought at its breakout price and sold at its intraday high.
3This represents the return if each stock were bought at its breakout price and sold at the most recent close.
Category |
Symbol |
Company Name |
Expected Gain1 |
|---|---|---|---|
| Best Overall | RICK | Rick's Caberet Intl | 108 |
| Top Technical | SSAG | SSA Global Technologies Inc | 26 |
| Top Fundamental | ENDP | Endo Pharmaceuticals Hld | 31 |
| Top Tech. & Fund. | ENDP | Endo Pharmaceuticals Hld | 31 |
Category |
Symbol |
Company Name |
Expected Gain1 |
|---|---|---|---|
| Best Overall | JDO | Jed Oil Inc | 63 |
| Top Technical | TBBK | The Bancorp Bank | 41 |
| Top Fundamental | TBBK | The Bancorp Bank | 41 |
| Top Tech. & Fund. | TBBK | The Bancorp Bank | 41 |
If you received this newletter from a friend and you would like to receive it regularly please go to the BreakoutWatch.com site and enter as a Guest. You will then be able to register to receive the newsletter.
Copyright © 2006 NBIcharts, LLC dba BreakoutWatch.com. All rights reserved.
" BreakoutWatch," the BreakoutWatch.com "eye" logo, and the slogan "tomorrow's breakouts today" are service marks of NBIcharts LLC. All other marks are the property of their respective owners, and are used for descriptive purposes only.