| Market Summary | Weekly Breakout Report | Top Breakout Choices | Top 2nd Chances | New Features | Tip of the Week |
This weeks Tips
- Effect of Breakout Gaps on Breakout Returns
- 5-Day Close added to Swing Trade List
- TradeWatch Portfolio Simulation Extended to Day Trade and Swing Trade lists
Market Summary
Investors focused on the election and its aftermath this week with little economic news to divert their attention. There was initially optimism that with control of congress split and a Republican President able to exercise the veto power on any legislation unfriendly to business emanating from the House, the outcome would be benign for business and the markets posted three accumulation days in succession. They soon found reason to worry, however, as the Democrats gained control of the Senate and a distribution day followed on Thursday. The bulls regained control near the close on Friday, after a day of light trading, and the markets closed with a substantial gain for the week. The NASDAQ Composite outperformed the broader markets with a gain of 2.53% while the DJI and S&P 500 managed less than half that with gains of 1.02% and 1.22% respectively.
Last week we noted that the NASDAQ had completed a bearish head and shoulders pattern so we were confounded by the strong gains in that index this week. The primary trend is still upward but we can expect the markets to continue to find reason to doubt that the trend can be sustained and these moments of angst can produce sharp reactions as they did on Thursday. The markets will continue to climb this 'wall of worry' until the trends is broken, but it will be nearly impossible to anticipate it. The best we can do is confirm it as it happens. Our market model issued an exit signal on May 10 which protected our subscribers against a 17% decline in the NASDAQ and now is registering 3 distribution days in the last 14 sessions. Even if the count goes to four on Monday, one would drop off on Tuesday, so we are several days away from a possible exit signal yet. Yet we continue to be nervous because the bond markets are continuing to forecast a recession for next year. The burst housing market bubble, continuing high inflation and high energy costs provide reasons for concern. Although energy costs are well below their highs, they are still historically high and provide inflationary pressure. Next week, investors will focus on wholesale inflation figures due on Tuesday and retail figures due Thursday as well as the minutes of the last FOMC meeting due to be released on Wednesday.
| Get a 14 day Trial of our premium 'Platinum'
service and TradeWatch for just $9.95 and if you subsequently subscribe
to any subscription level we will credit your $9.95 to your subscription.
14
Day Platinum Trial |
Recent Breakouts Report
This report now excludes breakouts that gapped up and did not trade within 5% of the breakout price on breakout day.
Performance Report
This report now also excludes breakouts that gapped up and did not trade within 5% of the breakout price on breakout day. The report has also been modified to look only at gains made within 12 months of breakout. (This will be effective Monday, 13/11/06)
TradeWatch
The closing price after 5 days added to the Swing Trade History report.
Portfolio Simulation extended to Day Trade and Swing Trade history.
Effect of Breakout Gaps on Breakout Returns
Some subscribers were concerned that our performance reporting was distorted because we included stocks that gapped up above 5% over their pivot price and did not trade within the 5% limit thereafter. We agree with them and have adjusted our performance reporting to include only stocks that traded within the 5% range on the breakout day. The effects can be seen in the comparison below, which shows the Recent Breakouts summary statistics as of Thursday, 10 November 2006. These cover the last 90 days of trading.
Breakout Summary
|
Including Breakout Gaps | Excluding Breakout Gaps |
Number of Sustained Breakouts |
585 |
505 |
Avg. % gain to intra-day high |
12.08% |
11.88% |
As you can see, although there were 80 stocks that gapped up and did not trade within 5% of the breakout price on breakout day, their affect on the overall average return was slight. Note that this is now a conservative result, because the 80 stocks may have traded within the 5% range subsequently, but they are not included in the analysis.
5-Day Close added to Swing Trade List
Our Swing trade list is derived from those stocks poised to breakout which our models show could give the best returns over the next five days. At the request of subscribers, we've now added the price at the close on the fifth day and calculated an average return based on a sale at that price. The result are available through the TradeWatch History > Swing Trade > Trades Filled menu choice. Note although the average return (as at 11/10/06) is 1.21% (or 60.3% annualized), the average gain to intraday high for this group is 5.6%. That means substantially better returns are possible by actively trading the group.
TradeWatch Portfolio Simulation Extended to Day Trade and Swing Trade lists
After we published the potential day trade results year-to-date last week, we were asked to add the day trade list to the Portfolio Simulation tool. We've now done that and included the Swing Trade list also. Note that in both cases the profit per trade is calculated using a sell price either at the end of day 1 (day trade) or day 5 (swing Trade).
When running the simulation on the day trade or swing trade list, it is important to understand the effect of the 'number of positions' parameter. This limits the amount invested per position. So if there is only 1 buy choice available on the day trade list, for example, on any given day, then only 1/n of your available cash will be applied to the position. The effect is that for the day trade and swing trade simulation, the best overall returns are obtained with a position number of 1. This means that for the day trade list all your available cash will be applied each day.
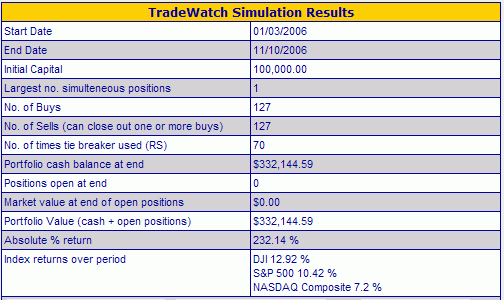
The results are quite impressive (modest understatement!). For the day trade scenario, using RS as the tie breaker and ignoring market signals (which have little short term effect), for the year-to-date, a $100,000 dollar portfolio would have grown to $332,155.

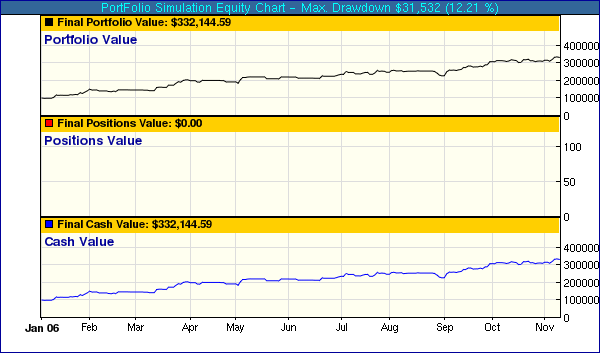
It also instructive to see how the portfolio value would have accumulated over the simulation period. Here is the 'Equity Chart' for the day trade simulation shown here.

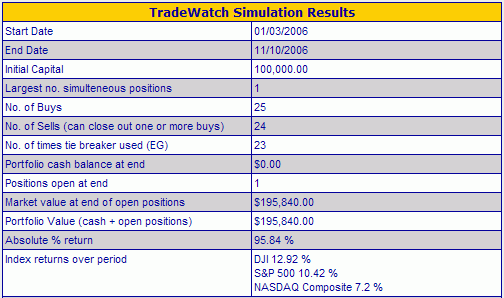
For the swing trade simulation, using market signals and Expected Gain as the tie breaker, the result was a 96% return.

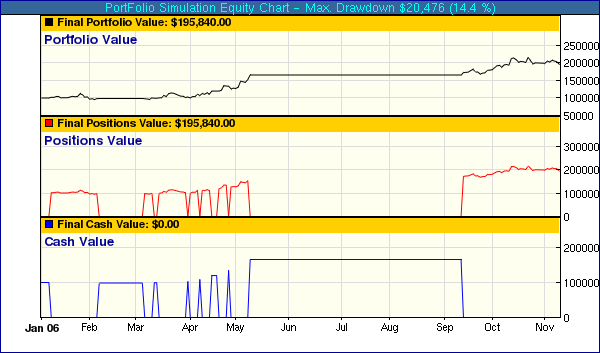
Here is the 'Equity Chart' for the swing trade simulation shown here. The flat periods on the Cash Value correspond to periods when the market signal was at exit and no trades were being executed.

Investment Advisors Using our Service
TradeRight Securities, located in a suburb of Chicago, is a full services investment management company and broker/dealer. They have been a subscriber, and user, of BreakoutWatch.com for some time now. They practice CANTATA and use Breakoutwatch.com as a “research analyst”. You can learn more about TradeRight Securities at: www.traderightsecurities.com. If you’re interested in speaking to a representative, simply call them toll-free at 1-800-308-3938 or e-mail gdragel@traderightsecurities.com.
PivotPoint Advisors, LLC takes a technical approach to investment planning and management. A breakoutwatch.com subscriber since May, 2004, they use breakouts, market signals, and now TradeWatch to enhance returns for their clients. Learn more at http://pivotpointadvisors.net or contact John Norquay at 608-826-0840 or by email at john.norquay@pivotpointadvisors.net.
Note to advisors: If you would like to be listed here, please contact us. As a service to those who subscribe to us, there is no additional charge to be listed here.
| Get a 14 day Trial of
our premium 'Platinum' service and TradeWatch for just $9.95 and
if you subsequently subscribe to any subscription
level we will credit your $9.95 to your subscription.
14
Day Platinum Trial |
| Index | Value | Change Week | Change YTD | Market1 Signal |
||||||||||||||||||||||||||||||||||||
|---|---|---|---|---|---|---|---|---|---|---|---|---|---|---|---|---|---|---|---|---|---|---|---|---|---|---|---|---|---|---|---|---|---|---|---|---|---|---|---|---|
| Dow | 12108.4 | 1.02% | 12.98% | enter | ||||||||||||||||||||||||||||||||||||
| NASDAQ | 2389.72 | 2.53% | 8.36% | enter | ||||||||||||||||||||||||||||||||||||
| S&P 500 | 1380.9 | 1.22% | 10.62% | enter | ||||||||||||||||||||||||||||||||||||
1The Market Signal is derived from our proprietary
market model. The market model is described on the site. 2The site also shows industry rankings based on fundamentals, combined technical and fundamentals, and on price alone (similar to IBD). The site also shows daily industry movements. |
||||||||||||||||||||||||||||||||||||||||
# of Breakouts
|
Period Average1
|
Max. Gain During Period2
|
Gain at Period Close3
|
|
|---|---|---|---|---|
| This Week | 42 | 44.54 | 4.32% | 1.69% |
| Last Week | 35 | 42.69 | 8.37% | 4.24% |
| 13 Weeks | 610 | 45.62 | 11.42% |
4.26% |
Sector
|
Industry
|
Breakout Count for Week
|
|---|---|---|
FINANCIAL SERVICES
|
Closed-End Fund - Equity
|
3
|
CHEMICALS
|
Agricultural Chemicals
|
2
|
DRUGS
|
Biotechnology
|
2
|
HEALTH SERVICES
|
Medical Appliances & Equipment
|
2
|
LEISURE
|
Resorts & Casinos
|
2
|
MANUFACTURING
|
Farm & Construction Machinery
|
2
|
TELECOMMUNICATIONS
|
Telecom Services - Foreign
|
2
|
COMPUTER SOFTWARE & SERVICES
|
Information Technology
|
1
|
COMPUTER SOFTWARE & SERVICES
|
Security Software & Services
|
1
|
CONSUMER NON-DURABLES
|
Paper & Paper Products
|
1
|
DIVERSIFIED SERVICES
|
Business Services
|
1
|
DIVERSIFIED SERVICES
|
Staffing & Outsourcing Services
|
1
|
DRUGS
|
Drug Manufacturers - Major
|
1
|
DRUGS
|
Drug Manufacturers - Other
|
1
|
DRUGS
|
Diagnostic Substances
|
1
|
ELECTRONICS
|
Scientific & Technical Instruments
|
1
|
ENERGY
|
Oil & Gas Equipment & Services
|
1
|
ENERGY
|
Major Integrated Oil & Gas
|
1
|
FINANCIAL SERVICES
|
Investment Brokerage - National
|
1
|
FINANCIAL SERVICES
|
Credit Services
|
1
|
FINANCIAL SERVICES
|
Investment Brokerage - Regional
|
1
|
FOOD & BEVERAGE
|
Food - Major Diversified
|
1
|
INSURANCE
|
Property & Casualty Insurance
|
1
|
INTERNET
|
Internet Software & Services
|
1
|
MANUFACTURING
|
Industrial Equipment & Components
|
1
|
MATERIALS & CONSTRUCTION
|
Heavy Construction
|
1
|
METALS & MINING
|
Silver
|
1
|
METALS & MINING
|
Gold
|
1
|
REAL ESTATE
|
Property Management
|
1
|
TELECOMMUNICATIONS
|
Communication Equipment
|
1
|
TRANSPORTATION
|
Shipping
|
1
|
TRANSPORTATION
|
Air Services, Other
|
1
|
UTILITIES
|
Foreign Utilities
|
1
|
WHOLESALE
|
Food Wholesale
|
1
|
2This represents the return if each stock were bought at its breakout price and sold at its intraday high.
3This represents the return if each stock were bought at its breakout price and sold at the most recent close.
Category |
Symbol |
Company Name |
Expected Gain1 |
|---|---|---|---|
| Best Overall | HL | Hecla Mining Co | 104 |
| Top Technical | WARR | Warrior Energy Service Corp | 52 |
| Top Fundamental | ISE | International Securities Excha | 40 |
| Top Tech. & Fund. | ISE | International Securities Excha | 40 |
Category |
Symbol |
Company Name |
Expected Gain1 |
|---|---|---|---|
| Best Overall | AUY | Yamana Gold Inc | 80 |
| Top Technical | TRA | Terra Industries Inc | 72 |
| Top Fundamental | ARA | Aracruz Celulose Sa New | 25 |
| Top Tech. & Fund. | ARA | Aracruz Celulose Sa New | 25 |
If you received this newletter from a friend and you would like to receive it regularly please go to the BreakoutWatch.com site and enter as a Guest. You will then be able to register to receive the newsletter.
Copyright © 2006 NBIcharts, LLC dba BreakoutWatch.com. All rights reserved.
" BreakoutWatch," the BreakoutWatch.com "eye" logo, and the slogan "tomorrow's breakouts today" are service marks of NBIcharts LLC. All other marks are the property of their respective owners, and are used for descriptive purposes only.