| Market Summary | Weekly Breakout Report | Top Breakout Choices | Top 2nd Chances | New Features | Tip of the Week |
Market Summary
With the uncertainty of the election behind us and strong evidence that inflation in both wholesale and retail prices was declining, the markets put in a strong performance this week with the NASDAQ Composite again leading the way with a 2.35% gain. We have seen increasing liquidity in the markets as funds come off the sidelines and the stocks comprising the DJI experienced strong accumulation for the second week, with the DJI setting new all-time highs and gaining 1.93%. The S&P 500, like the NASDAQ, is at a multi-year high and gained 1.47%. The minutes of the last FOMC meeting were released this week and they showed strong concern by all members that the rate of inflation is still unacceptably high. Although prices are falling, largely as a result of oil falling in recent weeks, there is the possibility that full employment, without increases in productivity, will drive up wages and inflation. This holds out the threat of interest rate rises in the future so there remains some uncertainty among investors about the future direction of interest rates. At the same time, there is also uncertainty about the impact that a collapsing housing market will have on consumer confidence, and the inverted yield curve still threatens a recession sometime next year. Although the housing market does not seem to have affected consumer spending so far, that could change once the holiday season is behind us. These uncertainties counterbalance the underlying bullish trend and are actually positive for the markets as they act as a brake on excessive exuberance.
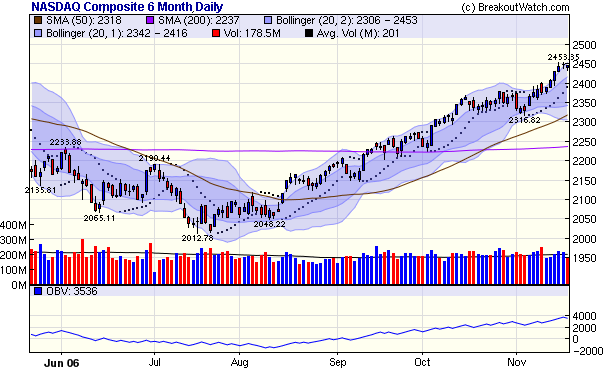
We usually look at the NASDAQ trend in detail because that is where the majority of new economy stocks are represented. We can see that since the turnaround in August, the index has mainly tracked between the 1 and 2 standard deviation Bollinger Bands (BB), with brief excursions beyond the outer band leading to quick consolidations. The PSAR (Parabolic Stop and Reverse Indicator) has also been a reliable indicator of when consolidations are about to occur, and when the upward trend will be resumed. This is an excellent example of how well the PSAR performs in a trending market. The steady inflow of funds into the NASDAQ market is clearly shown by the OBV line (OBV) . (The Bollinger Bands, PSAR and OBV are used in combination to issue sell signals with our Sell Assistant). The index has just turned inside the outer BB so we can expect some consolidation in the next few days. Look for it to cross the PSAR as an indication that a correction is beginning and that breakouts will become fewer and less strong. A cross of the inner BB to the down side will signal a more serious correction is in progress.

| Get a 14 day Trial of our premium 'Platinum'
service and TradeWatch for just $9.95 and if you subsequently subscribe
to any subscription level we will credit your $9.95 to your subscription.
14
Day Platinum Trial |
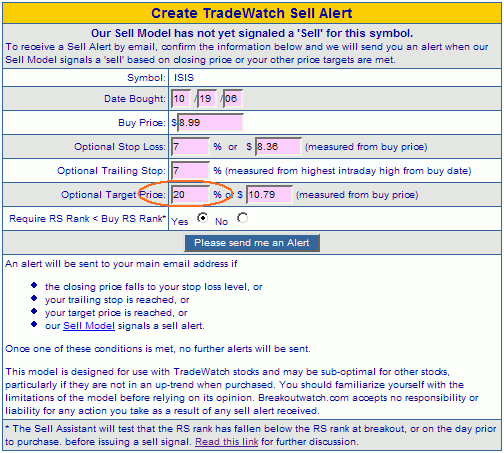
Sell Assistant Enhancement
A target % field has been added to the form that sets up a sell alert for you.

Strategy Forum Question: Buy on Breakout
Unless you make a habit of checking the Support and Strategy Forums regularly, you may miss some useful information. This week there was a question from a subscriber who was pleased with his results from using the Buy at Open strategy and was also considering using the Buy on Breakout list to increase his profit potential. (see http://www.breakoutwatch.com/phorum5/read.php?9,2464,2464#msg-2464).
His question serves as a useful reminder to all subscribers that all of our watchlists apply only to the next day's trading and so all orders placed with your broker should be day orders only. While a stock may appear on any of our lists on more than one successive day, it is easier, in our view, to keep adding a day order, than to remember to cancel a GTC order.
There are, of course, situations where the buy conditions are met on a subsequent day even though the stock may not be on a current list. This usually happens in a cup-with-handle pattern when a stock exceeds its pivot price but doesn't meet the volume requirement. In that case, a new pivot has been set and you must wait for a new handle to form. It can happen that the combined volume on the breakout day and the subsequent day(s) will exceed the 1.5 times average volume requirement, but that is considered a weak breakout and more prone to failure.
With the Buy on Breakout list a different situation can occur in which the daily breakout price and volume requirements are met but the recommended stop price is not achieved. The recommended stop is set at 2.5% above the breakout price because our analysis has shown that if stocks achieve that level on breakout day, they are much less prone to failure than other breakouts (see newsletter of 11/12/05). The question therefore arises as to whether or not the stock can be bought if it reaches the stop price on a subsequent day? The answer is no, because stocks like that would have been included in our initial analysis and if they were as successful as those that did meet the stop price, then the stop price threshold would be lower.
Investment Advisors Using our Service
TradeRight Securities, located in a suburb of Chicago, is a full services investment management company and broker/dealer. They have been a subscriber, and user, of BreakoutWatch.com for some time now. They practice CANTATA and use Breakoutwatch.com as a “research analyst”. You can learn more about TradeRight Securities at: www.traderightsecurities.com. If you’re interested in speaking to a representative, simply call them toll-free at 1-800-308-3938 or e-mail gdragel@traderightsecurities.com.
PivotPoint Advisors, LLC takes a technical approach to investment planning and management. A breakoutwatch.com subscriber since May, 2004, they use breakouts, market signals, and now TradeWatch to enhance returns for their clients. Learn more at http://pivotpointadvisors.net or contact John Norquay at 608-826-0840 or by email at john.norquay@pivotpointadvisors.net.
Note to advisors: If you would like to be listed here, please contact us. As a service to those who subscribe to us, there is no additional charge to be listed here.
| Get a 14 day Trial of
our premium 'Platinum' service and TradeWatch for just $9.95 and
if you subsequently subscribe to any subscription
level we will credit your $9.95 to your subscription.
14
Day Platinum Trial |
| Index | Value | Change Week | Change YTD | Market1 Signal |
||||||||||||||||||||||||||||||||||||
|---|---|---|---|---|---|---|---|---|---|---|---|---|---|---|---|---|---|---|---|---|---|---|---|---|---|---|---|---|---|---|---|---|---|---|---|---|---|---|---|---|
| Dow | 12342.6 | 1.93% | 15.16% | enter | ||||||||||||||||||||||||||||||||||||
| NASDAQ | 2445.86 | 2.35% | 10.91% | enter | ||||||||||||||||||||||||||||||||||||
| S&P 500 | 1401.2 | 1.47% | 12.25% | enter | ||||||||||||||||||||||||||||||||||||
1The Market Signal is derived from our proprietary
market model. The market model is described on the site. 2The site also shows industry rankings based on fundamentals, combined technical and fundamentals, and on price alone (similar to IBD). The site also shows daily industry movements. |
||||||||||||||||||||||||||||||||||||||||
# of Breakouts
|
Period Average1
|
Max. Gain During Period2
|
Gain at Period Close3
|
|
|---|---|---|---|---|
| This Week | 31 | 44.62 | 4.78% | 1.68% |
| Last Week | 42 | 44.54 | 8.14% | 4.55% |
| 13 Weeks | 610 | 46.85 | 12.43% |
5.91% |
Sector
|
Industry
|
Breakout Count for Week
|
|---|---|---|
INTERNET
|
Internet Software & Services
|
3
|
DRUGS
|
Biotechnology
|
2
|
INSURANCE
|
Property & Casualty Insurance
|
2
|
AEROSPACE/DEFENSE
|
Aerospace/Defense Products & Services
|
1
|
BANKING
|
Regional - Midwest Banks
|
1
|
CHEMICALS
|
Synthetics
|
1
|
DRUGS
|
Drug Related Products
|
1
|
ELECTRONICS
|
Semiconductor Equipment & Materials
|
1
|
ELECTRONICS
|
Semiconductor - Integrated Circuits
|
1
|
ENERGY
|
Oil & Gas Equipment & Services
|
1
|
ENERGY
|
Independent Oil & Gas
|
1
|
FINANCIAL SERVICES
|
Closed-End Fund - Equity
|
1
|
FOOD & BEVERAGE
|
Processed & Packaged Goods
|
1
|
HEALTH SERVICES
|
Medical Appliances & Equipment
|
1
|
HEALTH SERVICES
|
Medical Laboratories & Research
|
1
|
INSURANCE
|
Life Insurance
|
1
|
MANUFACTURING
|
Diversified Machinery
|
1
|
MEDIA
|
Marketing Services
|
1
|
METALS & MINING
|
Aluminum
|
1
|
METALS & MINING
|
Silver
|
1
|
METALS & MINING
|
Steel & Iron
|
1
|
REAL ESTATE
|
Mortgage Investment
|
1
|
TELECOMMUNICATIONS
|
Processing Systems & Products
|
1
|
TELECOMMUNICATIONS
|
Wireless Communications
|
1
|
TELECOMMUNICATIONS
|
Telecom Services - Domestic
|
1
|
TRANSPORTATION
|
Major Airlines
|
1
|
WHOLESALE
|
Drugs Wholesale
|
1
|
2This represents the return if each stock were bought at its breakout price and sold at its intraday high.
3This represents the return if each stock were bought at its breakout price and sold at the most recent close.
Category |
Symbol |
Company Name |
Expected Gain1 |
|---|---|---|---|
| Best Overall | HL | Hecla Mining Co | 105 |
| Top Technical | WARR | Warrior Energy Service Corp | 53 |
| Top Fundamental | ISE | International Securities Excha | 43 |
| Top Tech. & Fund. | ISE | International Securities Excha | 43 |
Category |
Symbol |
Company Name |
Expected Gain1 |
|---|---|---|---|
| Best Overall | NABI | Nabi Biopharmaceuticals | 92 |
| Top Technical | LXU | Lsb Industries Inc | 64 |
| Top Fundamental | JRVR | James River Group Inc | 0 |
| Top Tech. & Fund. | JRVR | James River Group Inc | 0 |
If you received this newletter from a friend and you would like to receive it regularly please go to the BreakoutWatch.com site and enter as a Guest. You will then be able to register to receive the newsletter.
Copyright © 2006 NBIcharts, LLC dba BreakoutWatch.com. All rights reserved.
" BreakoutWatch," the BreakoutWatch.com "eye" logo, and the slogan "tomorrow's breakouts today" are service marks of NBIcharts LLC. All other marks are the property of their respective owners, and are used for descriptive purposes only.