| Market Summary | Weekly Breakout Report | Top Breakout Choices | Top 2nd Chances | New Features | Tip of the Week |
Market Summary
The market summary is somewhat shorter this week due to the work necessary to release a new enhancement to the Portfolio Simulation tool. See below.
The end of year rally resumed this week after fears that the economy was slowing too quickly were alleviated by growth in the services sector and rising employment. Wages are also rising, putting more money in consumer's pockets to spend this holiday season, but not at a rate likely to push inflation higher. For the week, the DJI gained 0.93%, the NASDAQ Composite added 1% and the S&P 500 rose 0.94%. The S&P 500 set a new 6-year high on Thursday and finished the week not far off that level.
December is traditionally the best month for the markets and that trend seems set to continue this year. The markets seem buoyed by optimism that as the economy weakens, the Fed will lower interest rates early in the new year. This could be good for stocks because the cost of corporate borrowing to support investment comes down, and that provides a basis for the current price levels. The stock market is encouraged in this view by the bond markets, where the inverted yield curve shows an expectation of a rate cut as the economy moves into recession. [One analyst is putting the chance of recession within the next 6 months at 79%]. However, if the dollar continues to fall, it is doubtful that the Fed has room to lower rates without causing it to weaken further. If the expected rate cut doesn't materialize then stocks could be seen as overvalued. It is unlikely that the US trade deficit will improve in the near term, so the strength of the dollar is dependant on demand for US treasuries. If the recent sharp downturn in the dollar was caused by China and Japan shifting some of their dollar holdings to the Euro, and that trend continues, then the stock and bond markets hope for a cut in interest rates may be disappointed.
The number of confirmed breakouts increased slightly to 34 this week. American Italian Past (PLB) broke out of a CwH pattern to gain 19.05%, as did Medarex (MEDX) to gain 12.57% and Take Two Interactive (TTWO) which gained 10.26%.
| Get a 14 day Trial of our premium 'Platinum'
service and TradeWatch for just $9.95 and if you subsequently subscribe
to any subscription level we will credit your $9.95 to your subscription.
14
Day Platinum Trial |
Sell Assistant Options are now Incorporated into The Tradewatch Portfolio Simulation
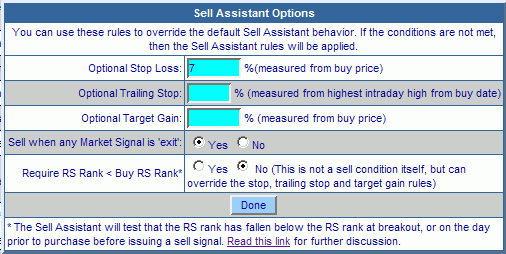
We have finally integrated the Sell Assistant options into the Portfolio Simulation for TradeWatch. There is now an additional row on the Portfolio Simulation giving you the option of choosing the default Sell Assistant behavior, or of adding the other options that are available with the Sell Assistant, that is stop loss %, trailing stop % and target price %. The new screen looks like this:
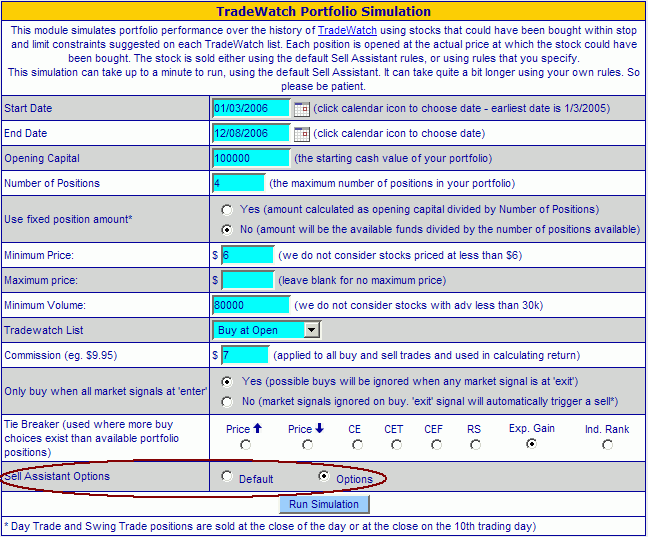
When selecting the 'Options' radio button, another window will open:
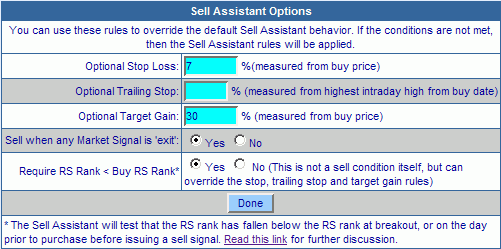
Entering values will override the Sell Assistant defaults when running the simulation. However, if the overrides you enter do not result in a sell signal for the stock, then the default Sell Assistant rules will apply. Suppose, for example, that you enter the values shown above but that subsequently the stock neither falls below 7% nor rises above 30%. In that case, the other Sell Assistant rules are considered and a sell signal could be issued based on those rules. In other words, the Sell Assistant options, take precedence over, but do not override, the Sell Assistants internal rules engine.
Some results using this new tool are presented below.
Using the Sell Assistant Optional Settings
Our Sell Assistant tool allows you to override the default settings by specifying your own stop loss, trailing stop from intraday high, or target price. Until now, we have not provided any guidance on the use of these options but the addition of the Sell Assistant Options to the TradeWatch simulation tool (see above) allows us to provide some backtesting results now.
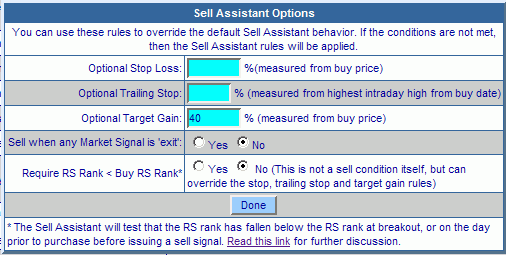
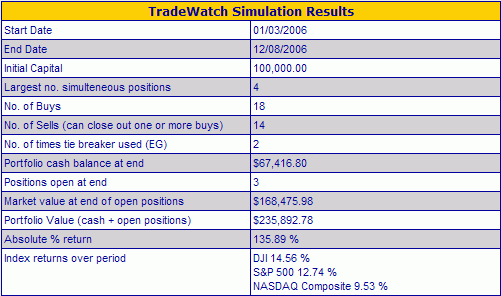
These results show that during 2006 to date, the best returns were obtained by using default Portfolio Simulation settings with the following Sell Assistant overrides:
This gave the following result:
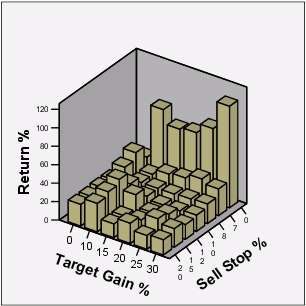
We found that using a stop loss, or a trailing stop was much less rewarding as the following 3-D bar charts show:
 |
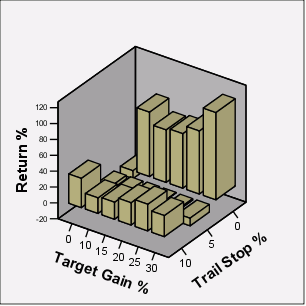 |
To arrive at these results, we backtested 1000 combinations of the Sell Assistant Options with the default Portfolio Simulation options. In the interests of transparency, these are available in an Excel spreadsheet here.
You can verify the results for yourself on-line, of course, and also see the trades that were made and the reasons for selling when you access the supporting files for each run.
So we now make the following recommendation for using the Sell Assistant in conjunction with TradeWatch - use a Target Gain of 30 - 40%. If the stock reaches that threshold, a sell alert will be issued. If the target is not met, then the default Sell Assistant rules will apply.
For those subscribers who are nervous about not using a stop loss, this tool allows you choose a stop loss value that is a reasonable compromise between overall return and safety. Our backtesting showed a very acceptable return of 81.6% was achieved with this combination of settings:
Investment Advisors Using our Service
TradeRight Securities, located in a suburb of Chicago, is a full services investment management company and broker/dealer. They have been a subscriber, and user, of BreakoutWatch.com for some time now. They practice CANTATA and use Breakoutwatch.com as a “research analyst”. You can learn more about TradeRight Securities at: www.traderightsecurities.com. If you’re interested in speaking to a representative, simply call them toll-free at 1-800-308-3938 or e-mail gdragel@traderightsecurities.com.
PivotPoint Advisors, LLC takes a technical approach to investment planning and management. A breakoutwatch.com subscriber since May, 2004, they use breakouts, market signals, and now TradeWatch to enhance returns for their clients. Learn more at http://pivotpointadvisors.net or contact John Norquay at 608-826-0840 or by email at john.norquay@pivotpointadvisors.net.
Note to advisors: If you would like to be listed here, please contact us. As a service to those who subscribe to us, there is no additional charge to be listed here.
| Get a 14 day Trial of
our premium 'Platinum' service and TradeWatch for just $9.95 and
if you subsequently subscribe to any subscription
level we will credit your $9.95 to your subscription.
14
Day Platinum Trial |
| Index | Value | Change Week | Change YTD | Market1 Signal |
||||||||||||||||||||||||||||||||||||
|---|---|---|---|---|---|---|---|---|---|---|---|---|---|---|---|---|---|---|---|---|---|---|---|---|---|---|---|---|---|---|---|---|---|---|---|---|---|---|---|---|
| Dow | 12307.5 | 0.93% | 14.84% | enter | ||||||||||||||||||||||||||||||||||||
| NASDAQ | 2437.36 | 1% | 10.52% | enter | ||||||||||||||||||||||||||||||||||||
| S&P 500 | 1409.84 | 0.94% | 12.94% | enter | ||||||||||||||||||||||||||||||||||||
1The Market Signal is derived from our proprietary
market model. The market model is described on the site. 2The site also shows industry rankings based on fundamentals, combined technical and fundamentals, and on price alone (similar to IBD). The site also shows daily industry movements. |
||||||||||||||||||||||||||||||||||||||||
# of Breakouts
|
Period Average1
|
Max. Gain During Period2
|
Gain at Period Close3
|
|
|---|---|---|---|---|
| This Week | 34 | 43.38 | 4.04% | 1.63% |
| Last Week | 32 | 43.15 | 7.02% | 3.27% |
| 13 Weeks | 601 | 45.38 | 13.41% |
7.04% |
Sector
|
Industry
|
Breakout Count for Week
|
|---|---|---|
METALS & MINING
|
Steel & Iron
|
3
|
FINANCIAL SERVICES
|
Closed-End Fund - Debt
|
2
|
HEALTH SERVICES
|
Specialized Health Services
|
2
|
AEROSPACE/DEFENSE
|
Aerospace/Defense Products & Services
|
1
|
BANKING
|
Regional - Midwest Banks
|
1
|
BANKING
|
Money Center Banks
|
1
|
COMPUTER SOFTWARE & SERVICES
|
Business Software & Services
|
1
|
COMPUTER SOFTWARE & SERVICES
|
Technical & System Software
|
1
|
COMPUTER SOFTWARE & SERVICES
|
Application Software
|
1
|
CONSUMER DURABLES
|
Sporting Goods
|
1
|
DIVERSIFIED SERVICES
|
Business Services
|
1
|
DRUGS
|
Biotechnology
|
1
|
ELECTRONICS
|
Semiconductor - Integrated Circuits
|
1
|
ENERGY
|
Independent Oil & Gas
|
1
|
ENERGY
|
Oil & Gas Equipment & Services
|
1
|
FINANCIAL SERVICES
|
Closed-End Fund - Equity
|
1
|
FINANCIAL SERVICES
|
Closed-End Fund - Foreign
|
1
|
FOOD & BEVERAGE
|
Processed & Packaged Goods
|
1
|
HEALTH SERVICES
|
Medical Instruments & Supplies
|
1
|
LEISURE
|
Gaming Activities
|
1
|
MANUFACTURING
|
Industrial Electrical Equipment
|
1
|
MEDIA
|
Broadcasting - TV
|
1
|
METALS & MINING
|
Industrial Metals & Minerals
|
1
|
METALS & MINING
|
Gold
|
1
|
TELECOMMUNICATIONS
|
Telecom Services - Domestic
|
1
|
TELECOMMUNICATIONS
|
Telecom Services - Foreign
|
1
|
TRANSPORTATION
|
Shipping
|
1
|
UTILITIES
|
Electric Utilities
|
1
|
2This represents the return if each stock were bought at its breakout price and sold at its intraday high.
3This represents the return if each stock were bought at its breakout price and sold at the most recent close.
Category |
Symbol |
Company Name |
Expected Gain1 |
|---|---|---|---|
| Best Overall | NICH | Nitches Inc | 101 |
| Top Technical | GRA | W.R. Grace & Co | 62 |
| Top Fundamental | MDR | Mcdermott Internat Inc | 39 |
| Top Tech. & Fund. | MDR | Mcdermott Internat Inc | 39 |
Category |
Symbol |
Company Name |
Expected Gain1 |
|---|---|---|---|
| Best Overall | CANI | Carreker Corporation | 77 |
| Top Technical | EXM | Excel Maritime Carriers | 45 |
| Top Fundamental | USAP | Universal Stain & Alloy | 35 |
| Top Tech. & Fund. | USAP | Universal Stain & Alloy | 35 |
If you received this newletter from a friend and you would like to receive it regularly please go to the BreakoutWatch.com site and enter as a Guest. You will then be able to register to receive the newsletter.
Copyright © 2006 NBIcharts, LLC dba BreakoutWatch.com. All rights reserved.
" BreakoutWatch," the BreakoutWatch.com "eye" logo, and the slogan "tomorrow's breakouts today" are service marks of NBIcharts LLC. All other marks are the property of their respective owners, and are used for descriptive purposes only.