| Market Summary | Weekly Breakout Report | Top Breakout Choices | Top 2nd Chances | New Features | Tip of the Week |
Market Summary
The 'Santa Claus' rally faltered on Tuesday when the Federal Reserve continued to talk hawkishly on inflation. It resumed later in the week on strong earnings, surprisingly flat inflation and a slight increase in industrial production in November. For the week, the DJI gained 1.12%, the S&P 500 rose 1.22% and the NASDAQ Composite added 0.81%. The DJI closed at a record high while the S&P 500 and the NASDAQ composite set new six-year intraday highs on Friday before profit taking caused them to close well off their day's highs. Oil prices are rising as OPEC threatens to cut back production in February, but investors are ignoring the inflationary implications for now, as they reason that they have seen higher oil prices earlier this summer, without it affecting significantly slowing consumer consumption.
Friday's new highs were supported in part by renewed optimism over an interest rate cut in the New Year. The markets had been expecting a cut before the FOMC statement on Tuesday, but interpreted the statement as meaning a rate cut is unlikely, particularly as one committee member continued to hold out for a rate increase. The effect was that the Fed Futures market downgraded the possibility of a rate cut by March from 30% to 10% and the dollar rose. The flat inflation rate announced on Friday gave new hope for a cut and the expectation of a rate cut by March went back to 30% and a rate cut by June was fully priced in. Lower interest rates reduce companies borrowing costs and improve their bottom line, if the economy remains strong. Those bearish on the economic outlook cite announced employment cuts, rising mortgage delinquencies, weak residential construction, weaker freight transportation demand and weakening industrial production as evidence that the strong economy cannot be sustained long into next year. The bulls point to full employment, a rising stock market, a recovering dollar, steady interest rates and a bottom (?) in the residential real estate market as evidence that growth can continue, albeit at a lower rate.
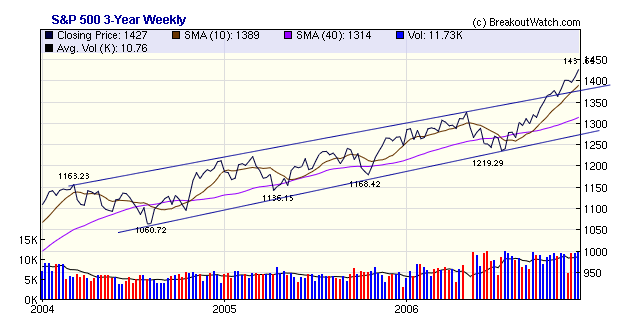
There is always tension between bulls and bears, and the bulls are winning at the moment. The question is how long they will continue to prevail. The S&P 500 has traded above its long term trend line over the last 5 weeks as the following weekly chart shows. We would expect a regression to the upper trend line, at least, early in the New Year.
The number of confirmed breakouts retreated slightly to 28 this week. This week's breakouts gained 1.37% by Friday's close, comfortably beating the major indexes.
| Get a 14 day Trial of our premium 'Platinum'
service and TradeWatch for just $9.95 and if you subsequently subscribe
to any subscription level we will credit your $9.95 to your subscription.
14
Day Platinum Trial |
Enhancements to CwHWatch Backtest and Daily Email
The CwHWatchlist filter backtest feature now reports the number of breakout alerts whereas it previously only reported confirmed breakouts. This allows you to asses to what extent your filters improve the percentage of confirmed breakouts.
Expected Gain for CwH breakouts was added to the daily email. As we only calculate expected gain for CwH breakouts, it is only available for those breakouts.
Enhancements to the Industry Browser
Following a suggestion from a subscriber, a search function was added to the Industry Browser. Entering a stock symbol will now automatically cause the browser to expand to the level of the industry containing the symbol. Links to the ranked industry list and 12 month industry charts were also added.
Performance Comparison between Bases
A subscriber asked me this week how the performance compares between bases. I had not compared the performance previously, so it was an interesting exercise to perform. We don't have sufficient history to include the head and shoulders bottom, so we only looked at the cup-with-handle, double bottom and flat base.
Using the same methodology that is used for the cup-with-handle performance report*, the results are as follows:
| Base | Start Date* |
No. of
Breakouts: |
%. of Breakouts Exceeding 5% Return: |
% of Failures | Average Return (incl. 8% stop losses): |
Average Days to Maximum gain: |
Annualized Rate of Return (incl. failures): |
|---|---|---|---|---|---|---|---|
Cup-with-Handle |
1/4/03 | 4402 |
71% | 18% | 49% | 175 | 102% |
Double Bottom |
6/15/04 | 149 |
78 % | 10% | 36 % | 182 | 72 % |
Flat Base |
3/19/04 | 368 |
66 % | 16% | 21 % | 192 | 40 % |
*The start date is date at which we first
introduced the base on our watchlists. |
|||||||
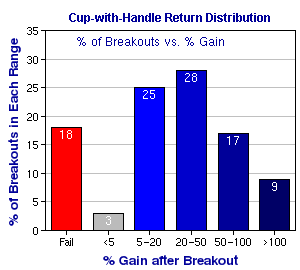
As you can see from the table above, the cup-with-handle base is by far the most common, but also has the highest failure rate. This is offset by a much higher average return, however. In other words, a higher return is achieved at a higher level of risk, as it should be. The distribution of returns for the cup-with-handle base is:
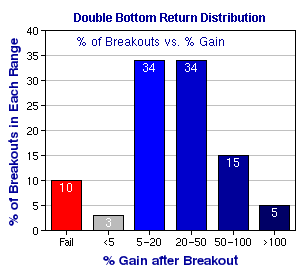
The Double Bottom base is the least common and has the lowest failure rate. This leads to more stocks exceeding the 5% gain line, but they return less on average than the cup-with-handle base and so their overall return is lower. So the Double Bottom breakout has less risk of failure and that lower risk comes at the cost of lower returns, as it should. The distribution of returns for the Double Bottom base is:
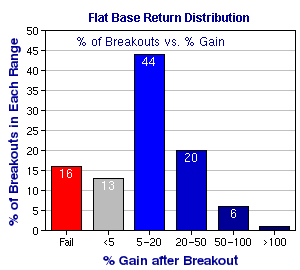
The flat base is a relatively poor performer. The failure rate is almost as high as for the cup-with-handle, but the average returns are much lower. On this evidence, buying Flat Base breakouts is a high risk, low return strategy. The distribution of returns from Flat Base breakouts is:
Important Note: The average returns shown are, of course, hypothetical and assume that each stock is sold at its subsequent highest intraday high. In practice, these returns could not be achieved. Nevertheless, I believe it does provide a useful way to compare the potential performance of each of the bases.
*Methodology
1. A 'breakout' occurs when a stock that is on our watchlist closes above the required minimum breakout price and volume. It is only included in the performance analysis if it traded within 5% of the breakout price on breakout day so stocks that gap up and do not trade within this range are excluded.
2. Price movements are followed at the close of that and each subsequent day for 12 months after breakout.
3. If the stock rises to 5% or more above the breakout price, the subsequent highest price achieved within 12 months is used to place the stock in one of the % gain after breakout categories shown in the accompanying charts, and to calculate the return. If the stock fails subsequently, it is not counted as a failure.
4. If the stock fails to reach 5% and then falls back to 8% or more below the breakout price, then the stock is counted in the 'fail' group and its subsequent performance ignored, unless it forms another base and breaks out again when it is treated as a separate breakout event.
5. Stocks that remain within the -8% to +5% range are still 'in-range' and counted in the <5% group. They are also used to calculate the overall return.
Investment Advisors Using our Service
TradeRight Securities, located in a suburb of Chicago, is a full services investment management company and broker/dealer. They have been a subscriber, and user, of BreakoutWatch.com for some time now. They practice CANTATA and use Breakoutwatch.com as a “research analyst”. You can learn more about TradeRight Securities at: www.traderightsecurities.com. If you’re interested in speaking to a representative, simply call them toll-free at 1-800-308-3938 or e-mail gdragel@traderightsecurities.com.
PivotPoint Advisors, LLC takes a technical approach to investment planning and management. A breakoutwatch.com subscriber since May, 2004, they use breakouts, market signals, and now TradeWatch to enhance returns for their clients. Learn more at http://pivotpointadvisors.net or contact John Norquay at 608-826-0840 or by email at john.norquay@pivotpointadvisors.net.
Note to advisors: If you would like to be listed here, please contact us. As a service to those who subscribe to us, there is no additional charge to be listed here.
| Get a 14 day Trial of
our premium 'Platinum' service and TradeWatch for just $9.95 and
if you subsequently subscribe to any subscription
level we will credit your $9.95 to your subscription.
14
Day Platinum Trial |
| Index | Value | Change Week | Change YTD | Market1 Signal |
||||||||||||||||||||||||||||||||||||
|---|---|---|---|---|---|---|---|---|---|---|---|---|---|---|---|---|---|---|---|---|---|---|---|---|---|---|---|---|---|---|---|---|---|---|---|---|---|---|---|---|
| Dow | 12445.5 | 1.12% | 16.12% | enter | ||||||||||||||||||||||||||||||||||||
| NASDAQ | 2457.2 | 0.81% | 11.42% | enter | ||||||||||||||||||||||||||||||||||||
| S&P 500 | 1427.09 | 1.22% | 14.32% | enter | ||||||||||||||||||||||||||||||||||||
1The Market Signal is derived from our proprietary
market model. The market model is described on the site. 2The site also shows industry rankings based on fundamentals, combined technical and fundamentals, and on price alone (similar to IBD). The site also shows daily industry movements. |
||||||||||||||||||||||||||||||||||||||||
# of Breakouts
|
Period Average1
|
Max. Gain During Period2
|
Gain at Period Close3
|
|
|---|---|---|---|---|
| This Week | 28 | 40.15 | 4.51% | 1.33% |
| Last Week | 34 | 43.38 | 6.11% | 0.13% |
| 13 Weeks | 562 | 45.15 | 13.76% |
6.81% |
Sector
|
Industry
|
Breakout Count for Week
|
|---|---|---|
COMPUTER SOFTWARE & SERVICES
|
Business Software & Services
|
2
|
FINANCIAL SERVICES
|
Closed-End Fund - Foreign
|
2
|
FINANCIAL SERVICES
|
Closed-End Fund - Debt
|
2
|
AUTOMOTIVE
|
Auto Parts
|
1
|
BANKING
|
Regional - Midwest Banks
|
1
|
BANKING
|
Savings & Loans
|
1
|
CHEMICALS
|
Specialty Chemicals
|
1
|
CONSUMER NON-DURABLES
|
Paper & Paper Products
|
1
|
CONSUMER NON-DURABLES
|
Rubber & Plastics
|
1
|
CONSUMER NON-DURABLES
|
Office Supplies
|
1
|
ELECTRONICS
|
Semiconductor - Integrated Circuits
|
1
|
ELECTRONICS
|
Scientific & Technical Instruments
|
1
|
ENERGY
|
Oil & Gas Equipment & Services
|
1
|
FINANCIAL SERVICES
|
Credit Services
|
1
|
FINANCIAL SERVICES
|
Closed-End Fund - Equity
|
1
|
HEALTH SERVICES
|
Medical Appliances & Equipment
|
1
|
HEALTH SERVICES
|
Specialized Health Services
|
1
|
INSURANCE
|
Accident & Health Insurance
|
1
|
INSURANCE
|
Insurance Brokers
|
1
|
INSURANCE
|
Property & Casualty Insurance
|
1
|
LEISURE
|
Resorts & Casinos
|
1
|
METALS & MINING
|
Steel & Iron
|
1
|
METALS & MINING
|
Aluminum
|
1
|
2This represents the return if each stock were bought at its breakout price and sold at its intraday high.
3This represents the return if each stock were bought at its breakout price and sold at the most recent close.
Category |
Symbol |
Company Name |
Expected Gain1 |
|---|---|---|---|
| Best Overall | IGTE | Igate Corporaion | 96 |
| Top Technical | DLIA | dELiA*s Inc | 57 |
| Top Fundamental | BGC | General Cable Corp | 37 |
| Top Tech. & Fund. | MDR | Mcdermott Internat Inc | 38 |
Category |
Symbol |
Company Name |
Expected Gain1 |
|---|---|---|---|
| Best Overall | SWKS | Skyworks Solutions Inc | 90 |
| Top Technical | GT | Goodyear Tire&Rubber Co | 49 |
| Top Fundamental | PMTI | Palomar Medical Tech | 48 |
| Top Tech. & Fund. | PMTI | Palomar Medical Tech | 48 |
If you received this newletter from a friend and you would like to receive it regularly please go to the BreakoutWatch.com site and enter as a Guest. You will then be able to register to receive the newsletter.
Copyright © 2006 NBIcharts, LLC dba BreakoutWatch.com. All rights reserved.
" BreakoutWatch," the BreakoutWatch.com "eye" logo, and the slogan "tomorrow's breakouts today" are service marks of NBIcharts LLC. All other marks are the property of their respective owners, and are used for descriptive purposes only.