| Market Summary | Weekly Breakout Report | Top Breakout Choices | Top 2nd Chances | New Features | Tip of the Week |
Market Summary
Market Signal at Enter
The markets made substantial gains this week and moved into positive territory for the year. Our market model registered a follow-through day on Tuesday and the NASDAQ signal reverted to enter. If you took advantage of this change of signal then you were rewarded with a strong rise on Wednesday following the release of the Federal Reserve's Open Market's Committee meeting. For the week, the DJI gained 3.06%, the NASDAQ Composite jumped 3.52% and the S&P 500 fared best with a 3.54% gain. Notably absent from the trading pattern was an increase in volume, however. All three indexes traded below the volume levels of the last three weeks and only the S&P 500 traded above the 10 week (50 day) moving average. While the rejuvenated rally is welcome, we would have liked to see volume increase in line with the rise in prices. The strength of the current rally is therefore suspect on technical grounds.
There are fundamental grounds for the rally to be suspect also. The good news stories of the week were the Fed's change of bias towards a neutral position on interest rates rather than a bias towards raising them further, which was the prime (excuse the pun) reason for the spike on Wednesday afternoon, and an increase in sales of existing homes reported on Friday. These headlines mask real difficulties for the economy and stocks, however. The change in stance by the Fed indicates they recognize that there is now a risk of recession and that they may need to ease interest rates to help a flagging economy. While investors see this as a benefit because it lowers companies' borrowing and investment costs, it also signals that corporate profits will likely fall as the economy slows, which will not benefit stocks in the longer term. The increase in house sales was accompanied by an increase in the number of homes unsold and a fall in the median price of homes. The increase in inventory implies that prices have further to fall and this could be exagerated as mortgage qualification rules are tightened and available liquidity for borrowing diminishes. As home prices fall the consumer will feel less wealthy and consumer spending, which accounts for 70% of economic activity, will likely fall.
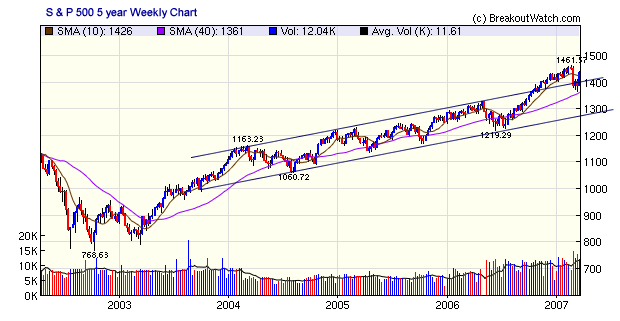
The S&P 500 chart shows that the index has recovered and is once again above its long term upper channel. While this is positive for the markets in the short term, a return to the long term trend is the most likely medium term outcome.

The number of breakouts ticked up slightly to twelve this week. The average gain for the week was substantially higher than that of the indexes at 4.3%. Parkervision (PRKR) gained 17.4% after breaking out from a cup-with-handle on two times average volume.
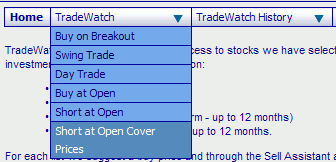
This week we introduce suggested cover prices for our Short at Open stock suggestions. They are accessed from the TradeWatch menu as shown here.

How to use the new display is described below.
How to Use Short at Open Cover Prices
Our new Cover Alerts display is designed to give you a heads-up on when a cover might be needed on stocks that have been on our Short at Open list. The display is based on our cover model and gives you a suggested cover price for the next day's trading. If the cover price isn't met then a new cover price will be suggested the next day, and so on until teh stock is covered.
The basis for the cover model was described in our 3/3/7 newsletter. It is based on three rules:
- the RSI must be less than 45
- the price must rise to the projected Parabolic Stop and Reverse (PSAR) value for the next session. This is the cover price.
- if these conditions are not met, then you should allow the stock to rise to 10% above the short price (price at which the short position was opened) before covering the position. This is because many short trades rise above the short price before they eventually succeed and we found 10% to be the optimal 'stop loss' level for these trades.
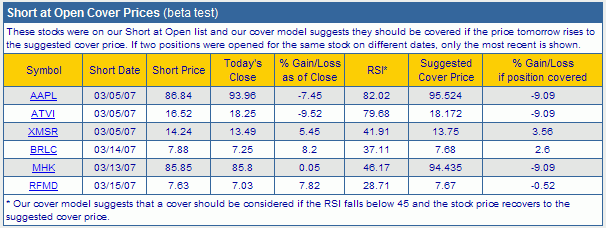
The Cover Alert display looks like this:

If the RSI based on the last close price is below 45 then the suggested cover price is based on the projected PSAR value. If the RSI has not fallen to less than 45, then the suggested cover price is the 10% stop loss value. The gain/loss percentages are calculated using the cover price, not the short price, as the basis for the trade. This leads to a real loss of 9.09% when a cover price of 10% above the short price is used.
If you have gone short on one of the stocks on our Short at Open list, and you are not able to monitor the market in real time, then you would use the cover price to place a Buy to Cover order with a stop price of the suggested cover price.
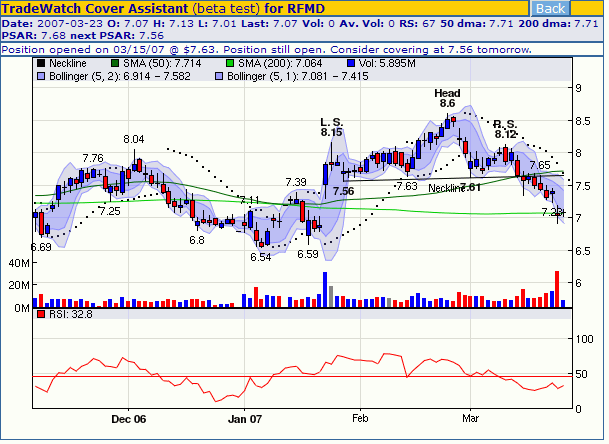
Clicking any symbol on the list will show an annotated Head and Shoulders chart such as the following:

Investment Advisors Using our Service
TradeRight Securities, located in a suburb of Chicago, is a full services investment management company and broker/dealer. They have been a subscriber, and user, of BreakoutWatch.com for some time now. They practice CANTATA and use Breakoutwatch.com as a “research analyst”. You can learn more about TradeRight Securities at: www.traderightsecurities.com. If you’re interested in speaking to a representative, simply call them toll-free at 1-800-308-3938 or e-mail gdragel@traderightsecurities.com.
PivotPoint Advisors, LLC takes a technical approach to investment planning and management. A breakoutwatch.com subscriber since May, 2004, they use breakouts, market signals, and now TradeWatch to enhance returns for their clients. Learn more at http://pivotpointadvisors.net or contact John Norquay at 608-826-0840 or by email at john.norquay@pivotpointadvisors.net.
Note to advisors: If you would like to be listed here, please contact us. As a service to those who subscribe to us, there is no additional charge to be listed here.
| Get a 14 day Trial of
our premium 'Platinum' service and TradeWatch for just $9.95 and
if you subsequently subscribe to any subscription
level we will credit your $9.95 to your subscription.
14
Day Platinum Trial |
| Index | Value | Change Week | Change YTD | Market1 Signal |
||||||||||||||||||||||||||||||||||||
|---|---|---|---|---|---|---|---|---|---|---|---|---|---|---|---|---|---|---|---|---|---|---|---|---|---|---|---|---|---|---|---|---|---|---|---|---|---|---|---|---|
| Dow | 12481 | 3.06% | 0.14% | enter | ||||||||||||||||||||||||||||||||||||
| NASDAQ | 2456.18 | 3.52% | 1.69% | enter | ||||||||||||||||||||||||||||||||||||
| S&P 500 | 1436.11 | 3.54% | 1.26% | enter | ||||||||||||||||||||||||||||||||||||
1The Market Signal is derived from our proprietary
market model. The market model is described on the site. 2The site also shows industry rankings based on fundamentals, combined technical and fundamentals, and on price alone (similar to IBD). The site also shows daily industry movements. |
||||||||||||||||||||||||||||||||||||||||
# of Breakouts
|
Period Average1
|
Max. Gain During Period2
|
Gain at Period Close3
|
|
|---|---|---|---|---|
| This Week | 12 | 19.38 | 7.38% | 4.7% |
| Last Week | 10 | 19.62 | 1.28% | -5.43% |
| 13 Weeks | 342 | 20.62 | 8.91% |
1.91% |
Sector
|
Industry
|
Breakout Count for Week
|
|---|---|---|
ELECTRONICS
|
Semiconductor Equipment & Materials
|
2
|
COMPUTER SOFTWARE & SERVICES
|
Information Technology
|
1
|
CONSUMER DURABLES
|
Electronic Equipment
|
1
|
DIVERSIFIED SERVICES
|
Business Services
|
1
|
DRUGS
|
Drug Manufacturers - Other
|
1
|
FINANCIAL SERVICES
|
Closed-End Fund - Debt
|
1
|
FINANCIAL SERVICES
|
Closed-End Fund - Equity
|
1
|
MANUFACTURING
|
Diversified Machinery
|
1
|
MATERIALS & CONSTRUCTION
|
Heavy Construction
|
1
|
METALS & MINING
|
Steel & Iron
|
1
|
RETAIL
|
Apparel Stores
|
1
|
2This represents the return if each stock were bought at its breakout price and sold at its intraday high.
3This represents the return if each stock were bought at its breakout price and sold at the most recent close.
Category |
Symbol |
Company Name |
Expected Gain1 |
|---|---|---|---|
| Best Overall | HGRD | Health Grades Inc | 92 |
| Top Technical | STTX | Steel Technologies Inc | 26 |
| Top Fundamental | BWLD | Buffalo Wild Wings | 34 |
| Top Tech. & Fund. | BWLD | Buffalo Wild Wings | 34 |
Category |
Symbol |
Company Name |
Expected Gain1 |
|---|---|---|---|
| Best Overall | IGTE | Igate Corporaion | 97 |
| Top Technical | SIGM | Sigma Designs Inc | 45 |
| Top Fundamental | ZUMZ | Zumiez Inc | 43 |
| Top Tech. & Fund. | ZUMZ | Zumiez Inc | 43 |
If you received this newletter from a friend and you would like to receive it regularly please go to the BreakoutWatch.com site and enter as a Guest. You will then be able to register to receive the newsletter.
Copyright © 2007 NBIcharts, LLC dba BreakoutWatch.com. All rights reserved.
" BreakoutWatch," the BreakoutWatch.com "eye" logo, and the slogan "tomorrow's breakouts today" are service marks of NBIcharts LLC. All other marks are the property of their respective owners, and are used for descriptive purposes only.