| Market Summary | Weekly Breakout Report | Top Breakout Choices | Top 2nd Chances | New Features | Tip of the Week |
Market Summary
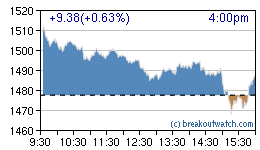
Last week, we anticipated that the markets would fall if the Fed did not deliver the expected 0.5% interest rate cut. Sure enough, the markets dropped like a stone immediately after the 0.25% cut was announced and the major indexes gave up most of the previous week's gains. The markets rallied the next morning on news of a massive injection of liquidity but the markets were not convinced the new 'fix' would hold and they sold off for the rest of the day until massive buying in the last 15 minutes by the 'Plunge Protection Team' (PPT) allowed the next day's headlines to read that the market had rallied on the injection of liquidity. Our chart of the intraday S&P 500 trading on Wednesday (12/12/07) illustrates what happened.
The pattern of sell-off followed by PPT action resumed the next day and again on Friday but this massive market manipulation could not prevent the major indexes from giving up the gains of the last month. For the week, the DJI lost 2.1%, the NASDAQ Composite dropped 2.6% and the S&P 500 gave up 2.44%.
Advance news of Friday's inflation numbers was probably available to the FOMC when they made their interest rate decision which explains why they only cut by 0.25%. With inflation accelerating the Fed and Treasury are now caught on the horns of a dilemma. A further cut in interest rates will likely increase inflation so there is little room to move rates lower. On the other hand further injections of liquidity will also increase inflation, so there seems to be little the Administration can do now to ward of the anticipated hard landing. In fact, if a realistic price deflator were used to adjust GDP numbers, we are probably already in recession.
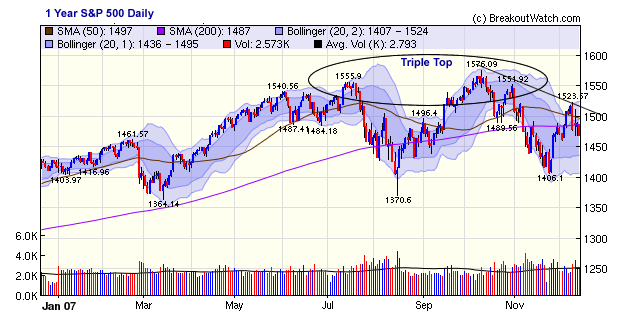
If so, then the markets are likely to fall further. The S&P 500 chart shows a bearish triple-top pattern. Although we may see another rally before year's end, the trend looks downward from here.
The number of breakouts fell to nine this week. However, as usual, they comfortably beat the market averages with an average gain of 2.73% by week's end.
No new features this week.
Our industry analysis tools allow you to answer the key questions related to the analysis of stocks by industry, either from the top down (i.e. drill down from an industry sector) or bottom up (i.e. from the individual stock to its industry group).
- What industry sector does a stock belong to?
- What are the competitors in that industry?
- How does the performance of that industry compare to others over the last 12 months?
- Which stocks in an industry present a possible entry point now?
Industry Browser
Our Industry Browser allows a top-down search by industry or search by individual stock. The Industry Browser is found under Evaluate > Industry Analysis from our main menu.
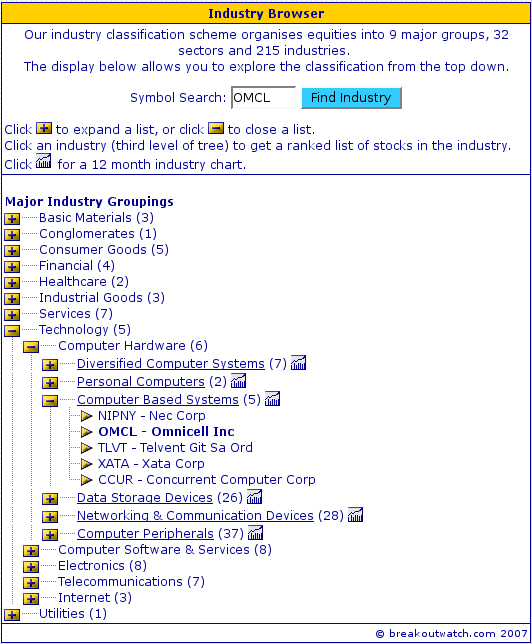
Entering a symbol will cause the tool to return an expanded industry list tree showing the Industry components to which the symbol belongs. The industry components are ranked in order of technical merit as measured by our CET indicator.
For example, entering symbol OMCL on 12/13/07 would have given the following display.
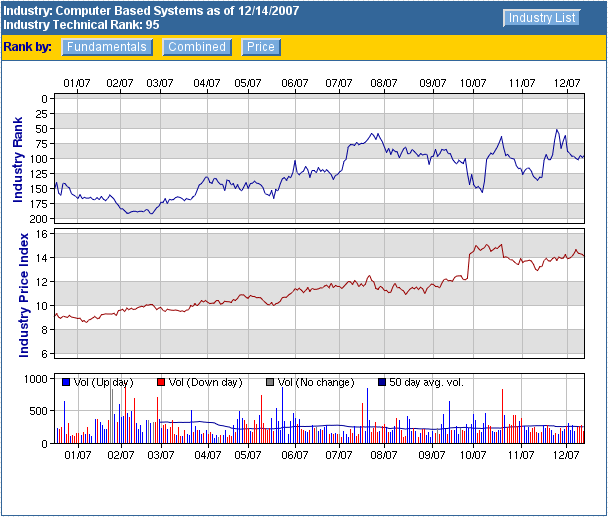
Clicking the industry name will bring up a list of the members of the industry group ranked in order of Relative Strength Rank. For the 'Computer Based Systems' group we obtain:
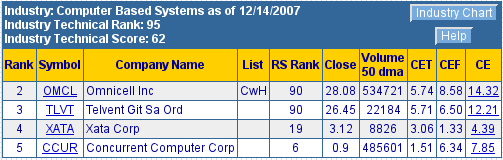
Note that in the 'List' column, there is a ' CwH' entry for OMCL. That indicates that OMCL currently appears on our cup-with-handle watch list and therefore could present an entry point opportunity if it breaks out.
Clicking the 'chart' icon next to the Industry Group name will show a chart of the industry's performance relative to other industries over the past 12 months.
To find the best (or worst) performing industries, then use our industry rankings and performance page which is accessed which is also accessed from Evaluate > Industry Analysis on the main menu.
Investment Advisors Using our Service
TradeRight Securities, located in a suburb of Chicago, is a full services investment management company and broker/dealer. They have been a subscriber, and user, of BreakoutWatch.com for some time now. They practice CANTATA and use Breakoutwatch.com as a “research analyst”. You can learn more about TradeRight Securities at: www.traderightsecurities.com. If you’re interested in speaking to a representative, simply call them toll-free at 1-800-308-3938 or e-mail gdragel@traderightsecurities.com.
Note to advisors: If you would like to be listed here, please contact us. As a service to those who subscribe to us, there is no additional charge to be listed here.
Get a 14 day free
Trial of our premium 'Platinum' service and TradeWatch.
No Credit Card Required.
Click
Here for 14 Day Free Trial |
| Index | Value | Change Week | Change YTD | Market1 Signal |
||||||||||||||||||||||||||||||||||||
|---|---|---|---|---|---|---|---|---|---|---|---|---|---|---|---|---|---|---|---|---|---|---|---|---|---|---|---|---|---|---|---|---|---|---|---|---|---|---|---|---|
| Dow | 13339.8 | -2.1% | 7.03% | enter | ||||||||||||||||||||||||||||||||||||
| NASDAQ | 2635.74 | -2.6% | 9.13% | enter | ||||||||||||||||||||||||||||||||||||
| S&P 500 | 1467.95 | -2.44% | 3.5% | enter | ||||||||||||||||||||||||||||||||||||
1The Market Signal is derived from our proprietary
market model. The market model is described on the site. 2The site also shows industry rankings based on fundamentals, combined technical and fundamentals, and on price alone (similar to IBD). The site also shows daily industry movements. |
||||||||||||||||||||||||||||||||||||||||
# of Breakouts
|
Period Average1
|
Max. Gain During Period2
|
Gain at Period Close3
|
|
|---|---|---|---|---|
| This Week | 10 | 16.23 | 5.07% | 2.46% |
| Last Week | 17 | 16.08 | 6.91% | 1.74% |
| 13 Weeks | 224 | 16.85 | 15.66% |
-0.58% |
Sector
|
Industry
|
Breakout Count for Week
|
|---|---|---|
HEALTH SERVICES
|
Medical Instruments & Supplies
|
2
|
BANKING
|
Foreign Regional Banks
|
1
|
DIVERSIFIED SERVICES
|
Research Services
|
1
|
DRUGS
|
Biotechnology
|
1
|
ENERGY
|
Major Integrated Oil & Gas
|
1
|
FOOD & BEVERAGE
|
Beverages - Soft Drinks
|
1
|
HEALTH SERVICES
|
Medical Appliances & Equipment
|
1
|
SPECIALTY RETAIL
|
Auto Dealerships
|
1
|
UTILITIES
|
Gas Utilities
|
1
|
2This represents the return if each stock were bought at its breakout price and sold at its intraday high.
3This represents the return if each stock were bought at its breakout price and sold at the most recent close.
Category |
Symbol |
Company Name |
Expected Gain1 |
|---|---|---|---|
| Best Overall | DVD | Dover Motorsports Inc | 81 |
| Top Technical | SHEN | Shenandoah Telecomm | 24 |
| Top Fundamental | FLR | Fluor Corp (New) | 33 |
| Top Tech. & Fund. | GLDN | Golden Telecom Inc | 29 |
Category |
Symbol |
Company Name |
Expected Gain1 |
|---|---|---|---|
| Best Overall | PZE | Petrobras Energia Part Sa | 52 |
| Top Technical | RUSHB | Rush Enterprises Inc Cl B | 29 |
| Top Fundamental | BAP | Credicorp Ltd | 30 |
| Top Tech. & Fund. | BAP | Credicorp Ltd | 30 |
If you received this newletter from a friend and you would like to receive it regularly please go to the BreakoutWatch.com site and enter as a Guest. You will then be able to register to receive the newsletter.
Copyright © 2007 NBIcharts, LLC dba BreakoutWatch.com. All rights reserved.
" BreakoutWatch," the BreakoutWatch.com "eye" logo, and the slogan "tomorrow's breakouts today" are service marks of NBIcharts LLC. All other marks are the property of their respective owners, and are used for descriptive purposes only.