| Market Summary | Weekly Breakout Report | Top Breakout Choices | Top 2nd Chances | New Features | Tip of the Week |
Market Summary
NASDAQ Market Signal goes to 'Exit'
Our market model gave an exit signal for the NASDAQ on Monday just in time for Tuesday's big sell-off. The signal came a little late because of fluctuating volume over the holiday period when accumulation/distribution days were unreliable. For the week, the NASDAQ lost 2.58%, the DJI slipped 1.51% and the S&P 500 0.75%.
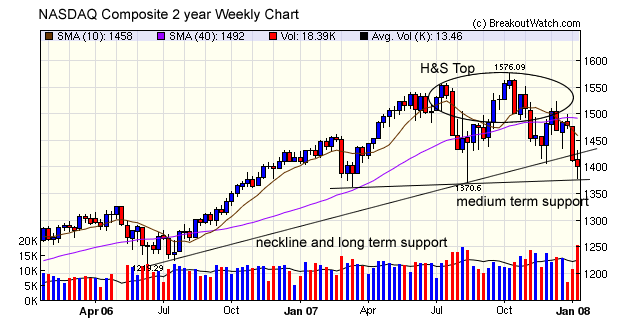
A look at the two year weekly chart for the NASADQ shows the perilous technical situation for the index. Charts for the DJI and S&P 500 are similarly bearish. The chart shows that the index completed a Head and Shoulders Top pattern last week when it broke through the neckline. Interestingly, that neckline coincided with the long term support line, so a breakdown from that H&S top has more than usual significance. On Wednesday the index rebounded from the medium term support line formed by lows for this year and a tentative rally began which was looking rather sickly by Friday. We expect the market to continue to make strong moves up and down as Fed and Treasury officials continue to make comments about the economy's strength and/or weakness but we favor the view that we are at the beginning of a bear market that could last until well into 2009. Treasury Secretary Paulson is now quite sanguine, and surprisingly frank for an administration official, about the state of the economy. Bloomberg news has released extracts from an interview with Paulson to be aired this weekend which shows his concern:
"There are signs the economy is slowing down fairly rapidly"
"We are looking at things that could be done quickly''
``Time is of the essence''
"There are risks to the downside"
Paulson said the housing market poses the biggest threat to the economy and made clear he expects home prices to continue to fall. "There's no doubt that this hasn't run its course yet''
With house prices continuing to fall, mortgage resets and foreclosures mounting, unemployment rising and credit tightening, it is easy to see how the economy and markets can falter as we come to the end of the consumer led expansion of the last few years.
No New Features this Week
Significance of Volume in High Tight Flag Breakouts
We continue our analysis of the High Tight Flag (HTF) pattern today.
We introduced alerts from the pattern this week but we departed from our usual emphasis on requiring heavy volume on breakout. To issue an alert, we only require that the intraday price exceed the pivot price and do not require that the volume exceed a specific multiple of the average daily volume (adv). This week we did an analysis of the volume on breakout day and concluded that this was the right decision.
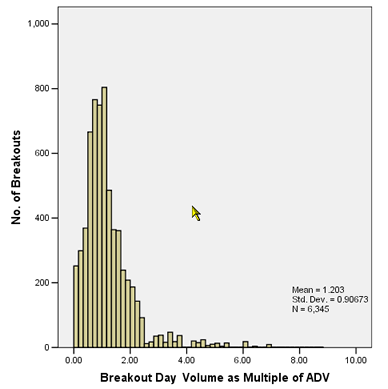
We looked at the breakout day volume on all HTF patterns that we recognised since 2000. A histogram of the number of breakouts compared to the breakout day volume shows that breakouts can occur at any multiple of adv, although they are more common between 0.3 times adv and 2.1 times adv.
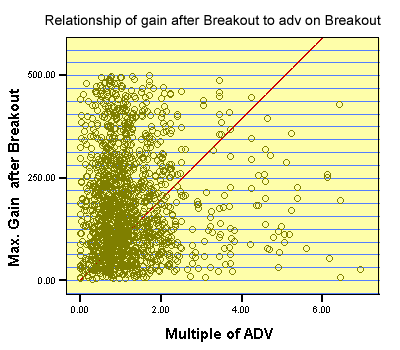
We also looked at the extent to which the eventual gain is related to the volume multiple on breakout day. We found that there was a significant correlation but there was no reason to set a threshold volume before investing in breakouts from this pattern. This scatterplot shows the regression line of max. gain after breakout to multiple of adv and its evident that high returns are possible even on low breakout volume.
Investment Advisors Using our Service
TradeRight Securities, located in a suburb of Chicago, is a full services investment management company and broker/dealer. They have been a subscriber, and user, of BreakoutWatch.com for some time now. They practice CANTATA and use Breakoutwatch.com as a “research analyst”. You can learn more about TradeRight Securities at: www.traderightsecurities.com. If you’re interested in speaking to a representative, simply call them toll-free at 1-800-308-3938 or e-mail gdragel@traderightsecurities.com.
Note to advisors: If you would like to be listed here, please contact us. As a service to those who subscribe to us, there is no additional charge to be listed here.
Get a 14 day free
Trial of our premium 'Platinum' service and TradeWatch.
No Credit Card Required.
Click
Here for 14 Day Free Trial |
| Index | Value | Change Week | Change YTD | Market1 Signal |
||||||||||||||||||||||||||||||||||||
|---|---|---|---|---|---|---|---|---|---|---|---|---|---|---|---|---|---|---|---|---|---|---|---|---|---|---|---|---|---|---|---|---|---|---|---|---|---|---|---|---|
| Dow | 12853.1 | 0.41% | -3.1% | enter | ||||||||||||||||||||||||||||||||||||
| NASDAQ | 2488.52 | -0.64% | -6.17% | exit | ||||||||||||||||||||||||||||||||||||
| S&P 500 | 1420.33 | 0.62% | -3.27% | enter | ||||||||||||||||||||||||||||||||||||
1The Market Signal is derived from our proprietary
market model. The market model is described on the site. 2The site also shows industry rankings based on fundamentals, combined technical and fundamentals, and on price alone (similar to IBD). The site also shows daily industry movements. |
||||||||||||||||||||||||||||||||||||||||
# of Breakouts
|
Period Average1
|
Max. Gain During Period2
|
Gain at Period Close3
|
|
|---|---|---|---|---|
| This Week | 15 | 13.92 | 6.86% | 3.74% |
| Last Week | 15 | 14.23 | 5.37% | -1.05% |
| 13 Weeks | 199 | 15.62 | 10.42% |
-2.17% |
Sector
|
Industry
|
Breakout Count for Week
|
|---|---|---|
DRUGS
|
Biotechnology
|
3
|
BANKING
|
Foreign Money Center Banks
|
1
|
CHEMICALS
|
Specialty Chemicals
|
1
|
CONSUMER DURABLES
|
Electronic Equipment
|
1
|
ELECTRONICS
|
Scientific & Technical Instruments
|
1
|
ENERGY
|
Oil & Gas Pipelines
|
1
|
FINANCIAL SERVICES
|
Closed-End Fund - Foreign
|
1
|
FINANCIAL SERVICES
|
Investment Brokerage - Regional
|
1
|
FINANCIAL SERVICES
|
Diversified Investments
|
1
|
HEALTH SERVICES
|
Specialized Health Services
|
1
|
HEALTH SERVICES
|
Health Care Plans
|
1
|
HEALTH SERVICES
|
Long-Term Care Facilities
|
1
|
METALS & MINING
|
Gold
|
1
|
2This represents the return if each stock were bought at its breakout price and sold at its intraday high.
3This represents the return if each stock were bought at its breakout price and sold at the most recent close.
Category |
Symbol |
Company Name |
Expected Gain1 |
|---|---|---|---|
| Best Overall | INOD | Innodata Isogen Inc | 110 |
| Top Technical | CHTP | Chelsea Therapeutics International Ltd | 77 |
| Top Fundamental | FTI | Fmc Technologies | 43 |
| Top Tech. & Fund. | FTI | Fmc Technologies | 43 |
Category |
Symbol |
Company Name |
Expected Gain1 |
|---|---|---|---|
| Best Overall | SUNH | Sun Healthcare Group Inc | 57 |
| Top Technical | SUNH | Sun Healthcare Group Inc | 57 |
| Top Fundamental | OMG | Om Group Inc | 37 |
| Top Tech. & Fund. | OMG | Om Group Inc | 37 |
If you received this newletter from a friend and you would like to receive it regularly please go to the BreakoutWatch.com site and enter as a Guest. You will then be able to register to receive the newsletter.
Copyright © 2008 NBIcharts, LLC dba BreakoutWatch.com. All rights reserved.
" BreakoutWatch," the BreakoutWatch.com "eye" logo, and the slogan "tomorrow's breakouts today" are service marks of NBIcharts LLC. All other marks are the property of their respective owners, and are used for descriptive purposes only.