| Market Summary | Weekly Breakout Report | Top Breakout Choices | Top 2nd Chances | New Features | Tip of the Week |
Friday brought news that the worst of the recession may be over as consumer confidence jumped by the most in two years and manufacturing contracted at a significantly slower rate. The major indexes rose, with the exception of the Russell 2000, but did not embrace this news with enthusiasm as volumes fell to well below average levels. Financial stocks fell as the Administration announced a delay in delivering the stress test results - a sure sign that they contain something that threatens to roil the markets and the delivery of the news is being carefully scripted to please the threatened banks. Will the spin be sufficient to sustain the rally? We'll find out on Thursday although Friday's jobs report may be a downer.
Chart of the Week
A new subscriber wrote to me of his frustration with IBD for not giving him a heads-up on potential breakouts so I have decided to introduce a new feature where each week I will present a chart with promising potential. This will not be a recommendation to buy - for that you must wait for the breakout - but if it does breakout, you saw it here first.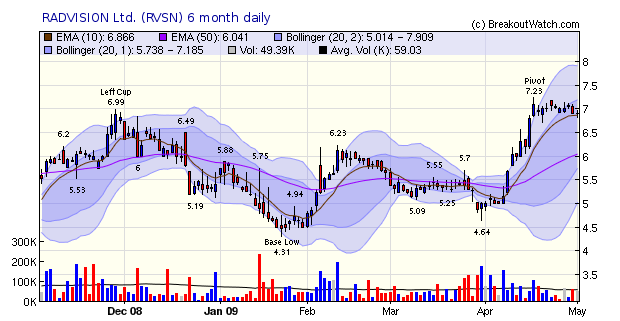
Radvision scores highly in our expected gain metric because of its high Relative Strength Rank (92) and recent upward moves on strong volume. Most of this is driven by a recent upwards revision of earnings estimates by 230% (source: AAII Journal, April 2009). On Thursday, their Chairman made a tender offer for an additional 5% of their shares to add to his current 24.5% holding. His offer price was $6.30 but the stock closed well above that level at $6.90 on Friday. Earnings are due to be reported on May 5.
This is not a CANSLIM stock - earnings have been negative (but are projected to turn substantially positive this year) and it is comparatively lightly traded with an average volume of just 59,000 shares. What I like about the chart is the big moves up on above average volume as it progressed up the right side of the cup and the declining volume in the handle. This is one to watch for a potential breakout on Tuesday if earnings are better than expected.
I also liked DGIT which is more of a mainstream pick with strong fundamentals, but a 6% drop on Friday on above average volume is worrisome, so it was not my chart of the week.
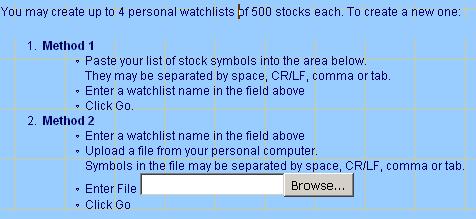
A limitation of the current personal watchlist page became apparent to me this week. The page only allows pasting of symbols from the clipboard, or manual entry. I wanted to update my Personal Watchlist with symbols from a screening service but was not able to copy the list to the clipboard, but I could save the symbols to a text file. I then needed to add the list to my Personal Watchlist so I modified the existing page to allow input from a file on my personal computer. I'm making this feature available to everyone now. The new PWL input page looks like this:
| Index | Value | Change Week | Change YTD | Trend | ||||||||||||||||||||||||||||||||||||
|---|---|---|---|---|---|---|---|---|---|---|---|---|---|---|---|---|---|---|---|---|---|---|---|---|---|---|---|---|---|---|---|---|---|---|---|---|---|---|---|---|
| Dow | 8212.41 | 1.69% | -6.43% | Down | ||||||||||||||||||||||||||||||||||||
| NASDAQ | 1719.2 | 1.47% | 9.02% | Up | ||||||||||||||||||||||||||||||||||||
| S&P 500 | 877.52 | 1.3% | -2.85% | Down | ||||||||||||||||||||||||||||||||||||
| Russell 2000 | 486.98 | 1.72% | -2.5% | Up | ||||||||||||||||||||||||||||||||||||
| Wilshire 5000 | 8998.73 | 1.53% | -0.97% | Down | ||||||||||||||||||||||||||||||||||||
1The Market Signal is derived from our proprietary
market model. The market model is described on the site. 2The site also shows industry rankings based on fundamentals, combined technical and fundamentals, and on price alone. The site also shows daily industry movements. |
||||||||||||||||||||||||||||||||||||||||
# of Breakouts |
Period Average1 |
Max. Gain During Period2 |
Gain at Period Close3 |
|
|---|---|---|---|---|
| This Week | 20 | 11.46 | 9.99% | 5.02% |
| Last Week | 20 | 10.54 | 11.91% | 1.7% |
| 13 Weeks | 140 | 12.15 | 20.45% |
10.5% |
2This represents the return if each stock were bought at its breakout price and sold at its intraday high.
3This represents the return if each stock were bought at its breakout price and sold at the most recent close.
Category |
Symbol |
Company Name |
Expected Gain1 |
|---|---|---|---|
| Best Overall | RVSN | Radvision Ltd. | 115 |
| Top Technical | DGIT | Digital Generation Syst | 76 |
| Top Fundamental | DGIT | Digital Generation Syst | 76 |
| Top Tech. & Fund. | DGIT | Digital Generation Syst | 76 |
Category |
Symbol |
Company Name |
Expected Gain1 |
|---|---|---|---|
| Best Overall | SMSI | Smith Micro Software Inc | 110 |
| Top Technical | CSTR | Coinstar Inc | 67 |
| Top Fundamental | CSTR | Coinstar Inc | 67 |
| Top Tech. & Fund. | CSTR | Coinstar Inc | 67 |
If you received this newsletter from a friend and you would like to receive it regularly please go to the BreakoutWatch.com site and enter as a Guest. You will then be able to register to receive the newsletter.
Copyright © 2009 NBIcharts, LLC dba BreakoutWatch.com.
All rights reserved.
"
BreakoutWatch," the BreakoutWatch.com "eye" logo, and the
slogan "tomorrow's breakouts today" are service marks of NBIcharts
LLC. All other marks are the property of their respective owners, and are
used for descriptive purposes only.
BreakoutWatch is not affiliated with Investor's Business Daily or with Mr. William O'Neil.
Our site, research and analysis is supported entirely by subscription and is free from advertising.