| Market Summary | Weekly Breakout Report | Top Breakout Choices | Top 2nd Chances | New Features | Tip of the Week |
Better than expected earnings by most companies reporting so far, the strength of profits at the major banks and upbeat forecasts from IBM and Intel gave the major indexes new impetus this week. The NASDAQ Composite broke through resistance on Wednesday and closed the week at a new high since March 9 and a gain for the week of 7.4%. The NASDAQ Composite is the only one of the indexes we follow to set a new high this week despite very solid gains for the other indexes - the Russell 2000 jumped almost 8% and our trend indicator for this index turned up again. Our trend indicators for the DJI and S&P 500 remain stubbornly negative. Historically, these indexes have not shown the volatility experienced in the last eighteen months and our models therefore continue to remain bearish. More important for breakout investors though is the trend of the NASDAQ and Russell 2000, as it is in these stocks that we can expect the most growth. Their upward trend indicates a positive outlook for successful breakouts.
This was confirmed with the number of breakouts which jumped from seven last week to twenty-six this week. Top performer was GROW which catapulted out of a double bottom base for a 20.5% gain.
Our Zacks Strong Buy report was amended to reflect the latest results as we continue to refine this exceptional strategy. The history report no longer assumes that stocks bought on a breakout alert but not confirmed as a breakout at day's end are sold at the next open.
ZSB Strategy Outperforms S&P 500 by factor of 9 in Bull Market
Since introducing the ZSB (Zacks Strong Buy) strategy, we have not seen the kind of gains that we would expect based on the backtest. We believe this is due to few companies issuing upwards earnings revisions but expect this will soon change as the economy improves. The evidence for this is found in a comparison of the performance of the ZSB strategy compared to the S&P 500 from July 2006 to September 2007. During this time, the S&P 500 had its best period in the last five years and gained 15%. Over the same period, our recommended ZSB strategy (2 positions, stop loss 3%) would have returned 136%.
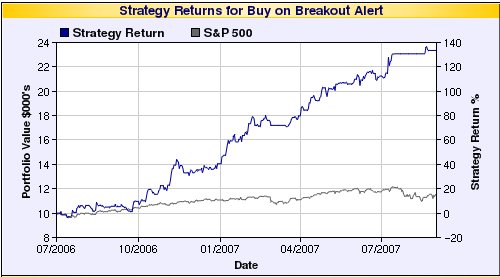
This performance can be verified using our ZSB Backtest Tool which is freely available to all.
| Index | Value | Change Week | Change YTD | Trend | ||||||||||||||||||||||||||||||||||||
|---|---|---|---|---|---|---|---|---|---|---|---|---|---|---|---|---|---|---|---|---|---|---|---|---|---|---|---|---|---|---|---|---|---|---|---|---|---|---|---|---|
| Dow | 8743.94 | 7.33% | -0.37% | Down | ||||||||||||||||||||||||||||||||||||
| NASDAQ | 1886.61 | 7.44% | 19.63% | Up | ||||||||||||||||||||||||||||||||||||
| S&P 500 | 940.38 | 6.97% | 4.11% | Down | ||||||||||||||||||||||||||||||||||||
| Russell 2000 | 519.22 | 7.95% | 3.96% | Up | ||||||||||||||||||||||||||||||||||||
| Wilshire 5000 | 9634.89 | 7.05% | 6.03% | Down | ||||||||||||||||||||||||||||||||||||
1The Market Signal is derived from our proprietary
market model. The market model is described on the site. 2The site also shows industry rankings based on fundamentals, combined technical and fundamentals, and on price alone. The site also shows daily industry movements. |
||||||||||||||||||||||||||||||||||||||||
# of Breakouts |
Period Average1 |
Max. Gain During Period2 |
Gain at Period Close3 |
|
|---|---|---|---|---|
| This Week | 26 | 16.08 | 8.14% | 5.86% |
| Last Week | 7 | 14.69 | 10.99% | 7.37% |
| 13 Weeks | 208 | 16.69 | 22.91% |
8.85% |
2This represents the return if each stock were bought at its breakout price and sold at its intraday high.
3This represents the return if each stock were bought at its breakout price and sold at the most recent close.
Category |
Symbol |
Company Name |
Expected Gain1 |
|---|---|---|---|
| Best Overall | RT | RUBY TUESDAY INC | 111 |
| Top Technical | GERN | Geron Corporation | 103 |
| Top Fundamental | ATHN | ATHENAHEALTH, INC. | 53 |
| Top Tech. & Fund. | EBIX | Ebix Inc | 56 |
Category |
Symbol |
Company Name |
Expected Gain1 |
|---|---|---|---|
| Best Overall | DGII | Digi International Inc | 88 |
| Top Technical | CTCT | CONSTANT CONTACT, INC. | 61 |
| Top Fundamental | MELI | MercadoLibre | 59 |
| Top Tech. & Fund. | MELI | MercadoLibre | 59 |
If you received this newsletter from a friend and you would like to receive it regularly please go to the BreakoutWatch.com site and enter as a Guest. You will then be able to register to receive the newsletter.
Copyright © 2009 NBIcharts, LLC dba BreakoutWatch.com.
All rights reserved.
"
BreakoutWatch," the BreakoutWatch.com "eye" logo, and the
slogan "tomorrow's breakouts today" are service marks of NBIcharts
LLC. All other marks are the property of their respective owners, and are
used for descriptive purposes only.
BreakoutWatch is not affiliated with Investor's Business Daily or with Mr. William O'Neil.
Our site, research and analysis is supported entirely by subscription and is free from advertising.