| Market Summary | Weekly Breakout Report | Top Breakout Choices | Top 2nd Chances | New Features | Tip of the Week |
The markets edged higher this week with the Russell 2000 being the only major index to fall, but only slightly. The overall impression is of a market that wants to move higher but is fearful that the six-month rally has left the market over-bought. While the recovery since March 9 has certainly been unusually strong, it is also true that the fall was extremely steep. It could be that what we lost on the roundabouts we have now regained on the swings and that market values are, as a result, about where they should be.
We have continued to work on our Zacks Stong Buy Strategy this week and the results are presented below. We were concerned that the results since we launched the strategy two months ago were not consistent with the five-year backtest but after bringing the backtest up to date we are satisfied that this strategy still has strong potential. Although the results since March 9 show only a gain of 30% compared to the S&P 500's 48% gain we think that's quite a good result considering the uncertainty and perceived risk in the market in that time frame.
To participate in this strategy you must first take out a 30 day trial with Zacks Investment Research. You can do so by clicking the Zack's Logo:
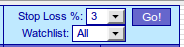
We've tweaked the reporting for this watchlist by adding an ability to filter the report by watchlist and also set the stop loss for reporting purposes.
There are now two drop downs at the top right-hand corner of the ZSB report page. After selecting the values, click the Go! link to regenerate the report.
Enhanced Zacks Strong Buy Backtest
The backtest database has now been updated to include data through August 14.
We've added a trailing stop loss factor to the backtest. This works by comparing the closing price each day to the highest intraday high since the stock was bought. If the close is less than the highest intraday high multiplied by the trailing stop factor, then the stock is presumed sold at the close.
To apply the stop loss factor in the real world, one would have to monitor the stock in real time or place a sell at close order.
The backtest can now be run with a stop based on alert price (the price at which it is assumed the stock was bought) and a trailing stop. Some examples are shown in the Top Tip section.
Using Trailing Stop for Enhanced Returns
Using the backtest tool to test the effect of using trailing stops is an interesting exercise which shows both the benefits and risks of using a trailing stop
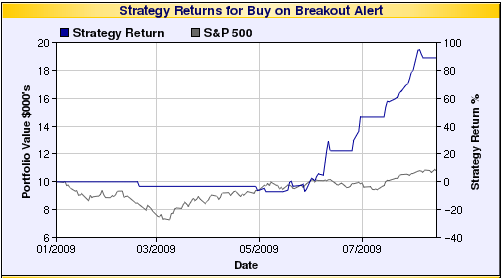
Lets first consider ZSB alerts from the High Tight Flag watchlist. We saw a plethora of HTF chart patterns after the March V-shaped bottom and ZSB alerts from this watchlist have done quite well this year.
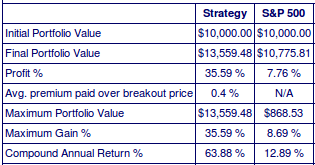 |
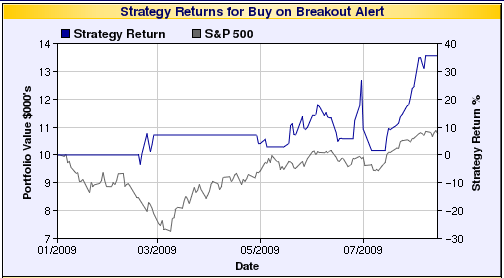
Here is a segment of the backtest results block and chart showing how a portfolio would have grown since the start of year using a stop pf 4% below the alert price and no trailing stop. There were few HTF choices until after the March 9 recovery which allowed several of these patterns to form. They then made some nice gains but market volatility also led to some sharp falls erasing much of the gains. The chart shows the sharp gains and losses clearly. |
 |
|
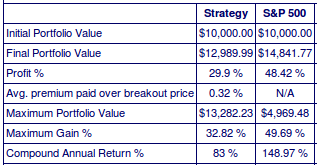
Now we consider the same HTF alerts but apply a trailing stop of 4%. |
|
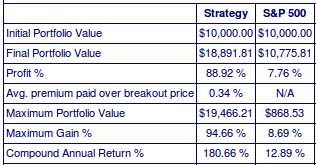 |
The backtest results show that the effect of the trailing stop is to conserve our gains and yield a return that more than doubles the return without a trailing stop. The chart below shows how much smoother and profitable the yield curve is. |
 |
|
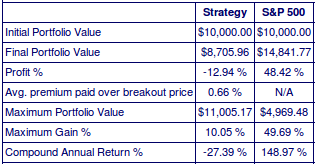
In contrast, using a trailing stop with ZSB alerts from the cup with handle list, even after March 9, left us with a loss because volatile market conditions created pullbacks that caused an early sale, often for a loss and reducing the capital available for the next position. These two tables show the results since March 9 using no trailing stop and a 4% trailing stop. The stop below BoP was 4% in both cases. Should you wish to se the corresponding charts, you can generate them yourself, and have fun with the backtest tool on the site. |
|
| CWH ZSB Alerts since 3/9/09, No Trailing Stop | CWH ZSB Alerts since 3/9/09, 4% Trailing Stop |
 |
 |
Although we take great care in producing these results, the introduction of any software change can have unexpected consequences on the rest of the software. For this reason we always provide transparency through the publication of the underlying assumptions and individual trades in the backtest. We invite you to verify these results for yourself with the backtest tool and we always welcome constructive criticism on the Support Forums.
| Index | Value | Change Week | Change YTD | Trend | ||||||||||||||||||||||||||||||||||||
|---|---|---|---|---|---|---|---|---|---|---|---|---|---|---|---|---|---|---|---|---|---|---|---|---|---|---|---|---|---|---|---|---|---|---|---|---|---|---|---|---|
| Dow | 9544.2 | 0.4% | 8.75% | Down | ||||||||||||||||||||||||||||||||||||
| NASDAQ | 2028.77 | 0.39% | 28.64% | Up | ||||||||||||||||||||||||||||||||||||
| S&P 500 | 1028.93 | 0.27% | 13.91% | Up | ||||||||||||||||||||||||||||||||||||
| Russell 2000 | 579.86 | -0.28% | 16.1% | Up | ||||||||||||||||||||||||||||||||||||
| Wilshire 5000 | 10579.6 | 0.26% | 16.42% | Up | ||||||||||||||||||||||||||||||||||||
1The Market Signal is derived from our proprietary
market model. The market model is described on the site. 2The site also shows industry rankings based on fundamentals, combined technical and fundamentals, and on price alone. The site also shows daily industry movements. |
||||||||||||||||||||||||||||||||||||||||
# of Breakouts |
Period Average1 |
Max. Gain During Period2 |
Gain at Period Close3 |
|
|---|---|---|---|---|
| This Week | 9 | 12.92 | 9.41% | 4.2% |
| Last Week | 10 | 13.31 | 10.58% | 5.81% |
| 13 Weeks | 160 | 14.15 | 24.71% |
13.3% |
2This represents the return if each stock were bought at its breakout price and sold at its intraday high.
3This represents the return if each stock were bought at its breakout price and sold at the most recent close.
Category |
Symbol |
Company Name |
Expected Gain1 |
|---|---|---|---|
| Best Overall | TLB | Talbots Inc | 124 |
| Top Technical | PRSC | Providence Service Corp The | 75 |
| Top Fundamental | ULTA | ULTA SALON, COSMETICS & FRAGRANCE, INC. | 79 |
| Top Tech. & Fund. | ULTA | ULTA SALON, COSMETICS & FRAGRANCE, INC. | 79 |
Category |
Symbol |
Company Name |
Expected Gain1 |
|---|---|---|---|
| Best Overall | SDXC | SWITCH & DATA FACIL | 80 |
| Top Technical | SDXC | SWITCH & DATA FACIL | 80 |
| Top Fundamental | SDXC | SWITCH & DATA FACIL | 80 |
| Top Tech. & Fund. | SDXC | SWITCH & DATA FACIL | 80 |
If you received this newsletter from a friend and you would like to receive it regularly please go to the BreakoutWatch.com site and enter as a Guest. You will then be able to register to receive the newsletter.
Copyright © 2009 NBIcharts, LLC dba BreakoutWatch.com.
All rights reserved.
"
BreakoutWatch," the BreakoutWatch.com "eye" logo, and the
slogan "tomorrow's breakouts today" are service marks of NBIcharts
LLC. All other marks are the property of their respective owners, and are
used for descriptive purposes only.
BreakoutWatch is not affiliated with Investor's Business Daily or with Mr. William O'Neil.
Our site, research and analysis is supported entirely by subscription and is free from advertising.