| Market Summary | Weekly Breakout Report | Top Breakout Choices | Top 2nd Chances | New Features | Tip of the Week |
Our expectations that the rally would resume and that tightening Bollinger Bands could lead to a breakout were confirmed this week as the market continued the rally that resumed last Friday. The NASDAQ Composite, and the other indexes too, set new 11 month highs this week and broke above the two-standard deviation Bollinger Band before profit taking saw a mild pull-back on Friday. The 6-month chart of the NASDAQ shows that it is still below its medium term trend line so further gains could be made in the coming week.
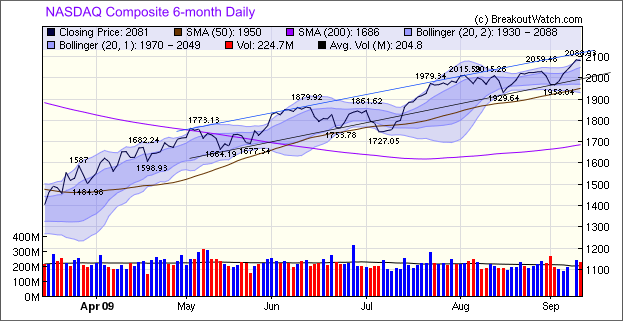
Friday's pull back was to be expected following the sharp gains made in the previous five sessions, particularly as investors are nervous that the current improvements in the global and domestic economies are fragile because some analysts have put the risk of the economy sliding back into recession as high as 1-in-3. But we are an optimistic bunch so the tendency remains to believe that things will get better, not worse.
There is some further support for the bullish case in an article by Barry Ritholz who uses an AAII chart to show that private investors are below the long term average asset allocation to stocks and that this condition is usually followed by an increased allocation in later months. In other words, there is the potential for more money to move into stocks from other assets which will drive prices higher.
No new features this week
New Free Trial Option
We recently reverted to our policy of charging $9.95 for a 30-day trial because some individuals were resorting to multiple free email accounts to obtain free trials. However, we have introduced a way to get a free trial through partnering with Zacks Investment Research. Now, if you subscribe to a 30-day free trial with Zacks, you can use your Zacks username and password to also get a 30-day free trial with breakoutwatch.com.
To get your 30-day free trial go to our free trial page
| Index | Value | Change Week | Change YTD | Trend | ||||||||||||||||||||||||||||||||||||
|---|---|---|---|---|---|---|---|---|---|---|---|---|---|---|---|---|---|---|---|---|---|---|---|---|---|---|---|---|---|---|---|---|---|---|---|---|---|---|---|---|
| Dow | 9605.41 | 1.74% | 9.45% | Down | ||||||||||||||||||||||||||||||||||||
| NASDAQ | 2080.9 | 3.08% | 31.95% | Up | ||||||||||||||||||||||||||||||||||||
| S&P 500 | 1042.73 | 2.59% | 15.44% | Up | ||||||||||||||||||||||||||||||||||||
| Russell 2000 | 593.59 | 4.05% | 18.85% | Up | ||||||||||||||||||||||||||||||||||||
| Wilshire 5000 | 10752.3 | 2.88% | 18.32% | Up | ||||||||||||||||||||||||||||||||||||
1The Market Signal is derived from our proprietary
market model. The market model is described on the site. 2The site also shows industry rankings based on fundamentals, combined technical and fundamentals, and on price alone. The site also shows daily industry movements. |
||||||||||||||||||||||||||||||||||||||||
# of Breakouts |
Period Average1 |
Max. Gain During Period2 |
Gain at Period Close3 |
|
|---|---|---|---|---|
| This Week | 21 | 11.15 | 8.22% | 4.48% |
| Last Week | 5 | 10.77 | 17.49% | 6.45% |
| 13 Weeks | 152 | 11.92 | 21.47% |
11.77% |
2This represents the return if each stock were bought at its breakout price and sold at its intraday high.
3This represents the return if each stock were bought at its breakout price and sold at the most recent close.
Category |
Symbol |
Company Name |
Expected Gain1 |
|---|---|---|---|
| Best Overall | EVOL | Evolving Systems Inc | 129 |
| Top Technical | MSSR | McCormick & Schmicks Seafood | 87 |
| Top Fundamental | COMV | COMVERGE, INC. | 76 |
| Top Tech. & Fund. | COMV | COMVERGE, INC. | 76 |
Category |
Symbol |
Company Name |
Expected Gain1 |
|---|---|---|---|
| Best Overall | ADPI | American Dental Partners | 73 |
| Top Technical | ADPI | American Dental Partners | 73 |
| Top Fundamental | ADPI | American Dental Partners | 73 |
| Top Tech. & Fund. | ADPI | American Dental Partners | 73 |
If you received this newsletter from a friend and you would like to receive it regularly please go to the BreakoutWatch.com site and enter as a Guest. You will then be able to register to receive the newsletter.
Copyright © 2009 NBIcharts, LLC dba BreakoutWatch.com.
All rights reserved.
"
BreakoutWatch," the BreakoutWatch.com "eye" logo, and the
slogan "tomorrow's breakouts today" are service marks of NBIcharts
LLC. All other marks are the property of their respective owners, and are
used for descriptive purposes only.
BreakoutWatch is not affiliated with Investor's Business Daily or with Mr. William O'Neil.
Our site, research and analysis is supported entirely by subscription and is free from advertising.