| Market Summary | Weekly Breakout Report | Top Breakout Choices | Top 2nd Chances | New Features | Tip of the Week |
The bloom is somewhat off the economic rose and markets are reacting to the reality that recovery from the deepest recession in 70 years will be a long and painful process.
It looks as though we have seen a top in the NASDAQ Composite (and the other indexes) for the time being. The chart shows that the medium term support trend line intersects with the former resistance, now support, level at around 2059. That is just 1.6% below Friday's close so we can expect a test of support at that level in the next couple of days.
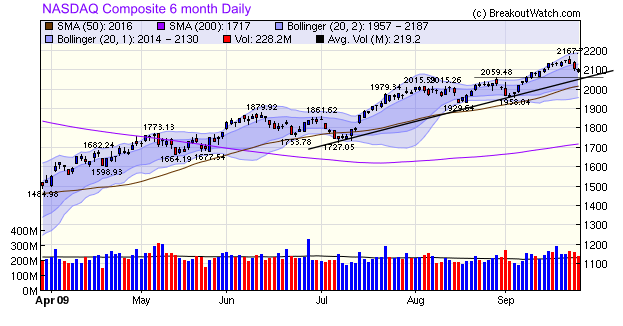
If that level doesn't hold then the NASDAQ is likely to correct to its 50 dma level (2016) before receiving some support.
The number of breakouts dropped off sharply this week and we can expect that to continue as the consolidation continues. As we noted last week, the High Tight Flag pattern is continuing to produce some excellent performances with BC and ACLI making intraday gains of over 10%.,
Our Site Search engine has been broken for some time since Google modified their API and started charging a fee based on the number of pages indexed. I'm pleased to report that we have now implemented another search engine and over seven hundred pages on our site have now been indexed and are searchable.
The new search is available from the sidebar after logging in.
| Index | Value | Change Week | Change YTD | Trend | ||||||||||||||||||||||||||||||||||||
|---|---|---|---|---|---|---|---|---|---|---|---|---|---|---|---|---|---|---|---|---|---|---|---|---|---|---|---|---|---|---|---|---|---|---|---|---|---|---|---|---|
| Dow | 9665.19 | -1.58% | 10.13% | Down | ||||||||||||||||||||||||||||||||||||
| NASDAQ | 2090.92 | -1.97% | 32.59% | Up | ||||||||||||||||||||||||||||||||||||
| S&P 500 | 1044.38 | -2.24% | 15.62% | Up | ||||||||||||||||||||||||||||||||||||
| Russell 2000 | 598.94 | -3.07% | 19.92% | Up | ||||||||||||||||||||||||||||||||||||
| Wilshire 5000 | 10771.6 | -2.36% | 18.54% | Up | ||||||||||||||||||||||||||||||||||||
1The Market Signal is derived from our proprietary
market model. The market model is described on the site. 2The site also shows industry rankings based on fundamentals, combined technical and fundamentals, and on price alone. The site also shows daily industry movements. |
||||||||||||||||||||||||||||||||||||||||
# of Breakouts |
Period Average1 |
Max. Gain During Period2 |
Gain at Period Close3 |
|
|---|---|---|---|---|
| This Week | 10 | 14.23 | 5.87% | 0.22% |
| Last Week | 29 | 13.69 | 12.11% | -1.28% |
| 13 Weeks | 181 | 14.62 | 22.26% |
8.91% |
2This represents the return if each stock were bought at its breakout price and sold at its intraday high.
3This represents the return if each stock were bought at its breakout price and sold at the most recent close.
Category |
Symbol |
Company Name |
Expected Gain1 |
|---|---|---|---|
| Best Overall | NOG | NORTHERN OIL AND GAS | 115 |
| Top Technical | PRSC | Providence Service Corp The | 69 |
| Top Fundamental | GMCR | Green Mountain Coffee Roasters | 55 |
| Top Tech. & Fund. | GMCR | Green Mountain Coffee Roasters | 55 |
Category |
Symbol |
Company Name |
Expected Gain1 |
|---|---|---|---|
| Best Overall | OREX | OREXIGEN THERAPEUTIC | 80 |
| Top Technical | OREX | OREXIGEN THERAPEUTIC | 80 |
| Top Fundamental | OREX | OREXIGEN THERAPEUTIC | 80 |
| Top Tech. & Fund. | OREX | OREXIGEN THERAPEUTIC | 80 |
If you received this newsletter from a friend and you would like to receive it regularly please go to the BreakoutWatch.com site and enter as a Guest. You will then be able to register to receive the newsletter.
Copyright © 2009 NBIcharts, LLC dba BreakoutWatch.com.
All rights reserved.
"
BreakoutWatch," the BreakoutWatch.com "eye" logo, and the
slogan "tomorrow's breakouts today" are service marks of NBIcharts
LLC. All other marks are the property of their respective owners, and are
used for descriptive purposes only.
BreakoutWatch is not affiliated with Investor's Business Daily or with Mr. William O'Neil.
Our site, research and analysis is supported entirely by subscription and is free from advertising.