| Market Summary | Weekly Breakout Report | Top Breakout Choices | Top 2nd Chances | New Features | Tip of the Week |
This chart shows that the rebound from the lower band has begun and the index has also moved above the 50 dma. If the previous pattern repeats itself then we could see a gain of around 100 points (5%) in the index from here.
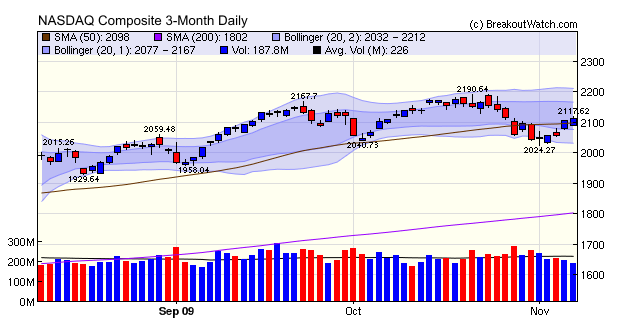
Although a short term gain in the index seems likely, we need some volume before we can expect any quantity of breakout candidates. Even though the index has risen quite strongly in three out of the last four sessions, volume has been noticeably weak, as the chart shows.
The decline in volume has greatly reduced the number of breakout candidates with just four breakout attempts being successful this week. Two of these were highly successful: DEER broke out from a High Tight Flag to make an intraday gain of 22.7% although profit taking reduced the gain to 8.6% by Friday's Close; ECPG broke out from a cup-with-handle base to gain 13.5% by Friday's close. ECPG first appeared on our watchlists this year as a high tight flag on May 19, although it never met our breakout criteria (handle became too long). Since March 9, this stock has gained 576%!
Why is volume so low? We can't be sure but the implication is that institutions, which have the most power to move the markets are not engaged. In turn, institutions, particularly mutual funds and ETF's, get their funds from private investors, but we know that there is around $3.5 trillion in cash sitting on the sidelines. When the private investor finally gains confidence in the recovery, we can expect the bull market to return in earnest.
* Our BB charts are slightly unusual in that we show both the 1 and 2 standard deviation bands.
We intend to make this new site available to all Silver level subscribers and above and should have that completed by next weekend.
There is a special introductory offer of $9.95 to the new site until November 30, 2009.
In our weekly commentary we remarked that our Bollinger Band
charts are slightly different from usual in that we show both the 1 and
2 standard deviation bands rather than just the 2 SD band. We do this
because the two bands working together can confirm trend changes.
To illustrate how the BB Bands can serve to confirm trend changes, here's an
example of Imperial Oil (IMO) the top ranked stock in the top ranked Oil and
Gas Canadian
group
that
has
performed well in 2005.
- Trend A shows the stock tracking between the lower two bands with a possible change in trend signaled as it crosses the inner band to the upside. This is labeled 'Buy Alert'.
- Trend B begins when the stock crosses out of the inner band to the outer band. This is labeled 'Buy Confirm'.
- Trend B continues until the stock closes within the inner band for the first time. This is labeled 'Sell Alert'.
- The stock now consolidates in area C. Notice that it never closes below the lower inner trend line but re-crosses the upper inner trend line at which point the sell alert is canceled.
- The stock now walks up the outer band until another Sell Alert is issued at the start of area E.
- Another period of consolidation begins (E) and the Sell Alert is canceled as the consolidation is completed and the stock moves out of the inner-band to the upside.
- Trend F now begins as the stock again walks up the outer band. A brief Sell Alert is issued in late September which is canceled the following day (not shown). Another Sell Alert is issued on October 4 and confirmed on October 5 as the stock closes below the lower inner band.
The strategy shown is a conservative one where a confirmation is required before the buy or sell alert is confirmed. A riskier strategy is to buy or sell on the initial alert but in that case it is desirable to have confirmation from other non-correlated indicators such as the RSI (or MACD) and On Balance Volume. (Note that the RSI and MACD should not be used together as they are both derived from closing price data alone). Using the BB Bands in conjunction with these indicators can help us determine when to sell a breakout that we might be holding. Here's an example of a recent breakout (9/16) that rose 53.5% in twelve sessions.
Following breakout the stock walked up the outer band but a sell
signal was given on 10/5 when the stock closed within the inner band.
This sell signal was confirmed on the same date as the RSI dropped
below the overbought line and the On Balance Volume (OBV) was clearly
in decline.
(This was adapted from our newsletter of 10/15/05)
| Index | Value | Change Week | Change YTD | Trend | ||||||||||||||||||||||||||||||||||||
|---|---|---|---|---|---|---|---|---|---|---|---|---|---|---|---|---|---|---|---|---|---|---|---|---|---|---|---|---|---|---|---|---|---|---|---|---|---|---|---|---|
| Dow | 10023.4 | 3.2% | 14.21% | Down | ||||||||||||||||||||||||||||||||||||
| NASDAQ | 2112.44 | 3.29% | 33.95% | Up | ||||||||||||||||||||||||||||||||||||
| S&P 500 | 1069.3 | 3.2% | 18.38% | Up | ||||||||||||||||||||||||||||||||||||
| Russell 2000 | 580.35 | 3.12% | 16.2% | Down | ||||||||||||||||||||||||||||||||||||
| Wilshire 5000 | 10965.4 | 3.26% | 20.67% | Up | ||||||||||||||||||||||||||||||||||||
1The Market Signal is derived from our proprietary
market model. The market model is described on the site. 2The site also shows industry rankings based on fundamentals, combined technical and fundamentals, and on price alone. The site also shows daily industry movements. |
||||||||||||||||||||||||||||||||||||||||
# of Breakouts |
Period Average1 |
Max. Gain During Period2 |
Gain at Period Close3 |
|
|---|---|---|---|---|
| This Week | 4 |
10.38 | 10.72% | 5.67% |
| Last Week | 6 | 11.15 | -2.38% | -6.38% |
| 13 Weeks | 143 | 11.54 | 16.47% |
-1.82% |
2This represents the return if each stock were bought at its breakout price and sold at its intraday high.
3This represents the return if each stock were bought at its breakout price and sold at the most recent close.
Category |
Symbol |
Company Name |
Expected Gain1 |
|---|---|---|---|
| Best Overall | WMG | Warner Music Group Corp | 98 |
| Top Technical | ELRN | Elron Electronic Ind Ltd | 84 |
| Top Fundamental | LFT | LONGTOP FINL TEC ADS | 39 |
| Top Tech. & Fund. | LFT | LONGTOP FINL TEC ADS | 39 |
Category |
Symbol |
Company Name |
Expected Gain1 |
|---|---|---|---|
| Best Overall | ITWO | i2 Technologies Inc | 59 |
| Top Technical | ITWO | i2 Technologies Inc | 59 |
| Top Fundamental | ITWO | i2 Technologies Inc | 59 |
| Top Tech. & Fund. | ITWO | i2 Technologies Inc | 59 |
If you received this newsletter from a friend and you would like to receive it regularly please go to the BreakoutWatch.com site and enter as a Guest. You will then be able to register to receive the newsletter.
Copyright © 2009 NBIcharts, LLC dba BreakoutWatch.com.
All rights reserved.
"
BreakoutWatch," the BreakoutWatch.com "eye" logo, and the
slogan "tomorrow's breakouts today" are service marks of NBIcharts
LLC. All other marks are the property of their respective owners, and are
used for descriptive purposes only.
BreakoutWatch is not affiliated with Investor's Business Daily or with Mr. William O'Neil.
Our site, research and analysis is supported entirely by subscription and is free from advertising.