| Market Summary | Weekly Breakout Report | Top Breakout Choices | Top 2nd Chances | New Features | Tip of the Week |
This weeks Top Tip contains an important new finding which could help you achieve better trading returns. Don't miss it!
Market is Technically Weak
The major indexes rose again this week but the weak volume levels continued. NASDAQ volume was 15% below the 50 day average while the S&P 500 was 27% below the 50 day average. Some of this lower volume could be explained perhaps by Wednesday's Veterans Day holiday but that couldn't account for all the missing volume. A rising market on lower volume is considered to be technically weak and may indicate that the rally is approaching its end.
There is evidence for this in the NASDAQ (and other charts) where the index has formed a head and shoulders top. The head and shoulders pattern can be bearish if the pattern is completed. Completion occurs when the index drops below the neck line. The neck line is shown on the chart.
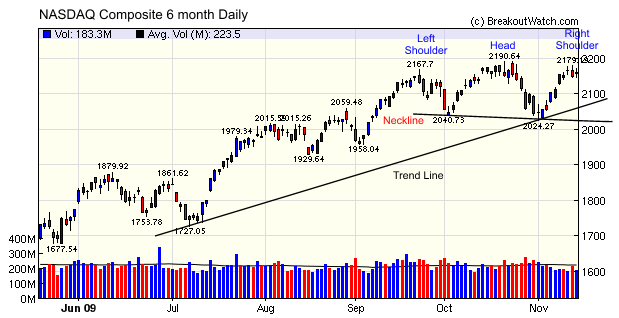
We can see that long before the pattern is completed the index
will test the support trend line if the index continues to fall. A fall
through the support trend line to pattern completion would be bearish
indeed as it would also undercut the 2024 support level.
A technically weak market affects the number and strength of
breakouts. A condition for most breakouts (except from a High Tight
Flag pattern) is that volume should be at least 50% above the 50 day
average. This requirement means that we issue far fewer breakout alerts
but also ensures that we are less tempted to trade. This conserves our
capital in an unfavorable market.
Which Breakouts Give the Best Return?
As every trader knows, stock picking is a percentage game. You will not pick winners 100% of the time, or possibly even 50% of the time, so you want to get the best possible return out of the winners that you do pick. (It is also important to minimize your losses through effective portfolio management but that is not the topic we are interested in today).
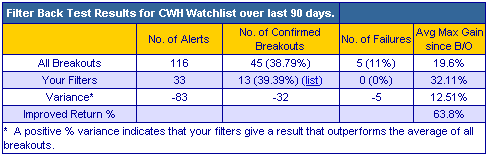
Every long position watchlist on our main site, breakoutwatch.com, has a backtest feature that allows you test various technical and fundamental conditions to see which ones are performing best over a recent time frame, up to one year. This allows you to fine tune the criteria you look for in a breakout to recent market conditions. The backtest tool requires that you test sets of filter conditions one at a time, but we also have a tool that allows us to simulate over many filter sets so we can analyze which ones work best. Its a resource hog so we don't make it publicly available but from time to time we run it and publish the results here. We published the results last in our August 1 newsletter. The results showed that choosing stocks with a minimum RS Rank of 91 and a minimum daily volume of 40k shares would improve your returns over all breakouts by 22%. Other factors were insignificant in selecting the best performing breakouts.
To see if current conditions have changed the outcome, we ran the simulation again on Friday, November 13 for the last 90 days. This time the results surprised us because we have never before found that using fundamental score as a filter criteria was beneficial*. Although the filters found in August still performed very well we found that adding a filter on fundamental score improved the return by another 50%.
Here are the results using the August filters:
Filter settings: RS Rank >= 91;BoV>=40k |
 |
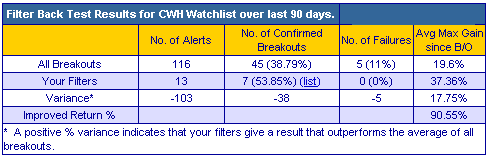
Now, we find that adding a minimum fundamental score of 4 to the selection filter improves the return over all breakouts by 90%:
Filter settings: RS Rank >= 91;BoV>=40k; FS>=4 |
 |
Using these filters would have found just seven confirmed breakouts in the last 90 days but this may be sufficient, depending on your trading style. The stocks that met the filter criteria and their performance is also available in our backtest software. They are:
Filter settings: RS Rank >= 91;BoV>=40k; FS>=4 |
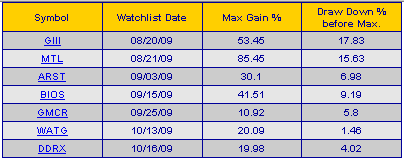 |
Note that the older breakouts have made the biggest gains, so far. There is still time for the newer breakouts to make equally strong gains.
* This always seems surprising to CAN SLIM investors but we have always found that RS Rank and technical strength was most important in predicting future performance. The reason was that stocks with high fundamentals had already achieved a positive valuation and had less upside potential. Recent market conditions have changed that equation because all stocks were beaten down and investors and traders are now looking for security and have preferred stocks with strong fundamentals. Hence they have risen most.
| Index | Value | Change Week | Change YTD | Trend | ||||||||||||||||||||||||||||||||||||
|---|---|---|---|---|---|---|---|---|---|---|---|---|---|---|---|---|---|---|---|---|---|---|---|---|---|---|---|---|---|---|---|---|---|---|---|---|---|---|---|---|
| Dow | 10249.9 | 2.26% | 16.79% | Down | ||||||||||||||||||||||||||||||||||||
| NASDAQ | 2160.67 | 2.28% | 37.01% | Up | ||||||||||||||||||||||||||||||||||||
| S&P 500 | 1090.91 | 2.02% | 20.78% | Up | ||||||||||||||||||||||||||||||||||||
| Russell 2000 | 580.7 | 0.06% | 16.27% | Down | ||||||||||||||||||||||||||||||||||||
| Wilshire 5000 | 11169.2 | 1.86% | 22.91% | Up | ||||||||||||||||||||||||||||||||||||
1The Market Signal is derived from our proprietary
market model. The market model is described on the site. 2The site also shows industry rankings based on fundamentals, combined technical and fundamentals, and on price alone. The site also shows daily industry movements. |
||||||||||||||||||||||||||||||||||||||||
# of Breakouts |
Period Average1 |
Max. Gain During Period2 |
Gain at Period Close3 |
|
|---|---|---|---|---|
| This Week | 7 | 10.31 | 5.51% | 2.06% |
| Last Week | 6 | 10.38 | 14.2% | 10.15% |
| 13 Weeks | 147 | 10.92 | 16.81% |
-0.18% |
2This represents the return if each stock were bought at its breakout price and sold at its intraday high.
3This represents the return if each stock were bought at its breakout price and sold at the most recent close.
Category |
Symbol |
Company Name |
Expected Gain1 |
|---|---|---|---|
| Best Overall | DAN | DANA HOLDINGS CORPORATION | 88 |
| Top Technical | GLS | GENESIS LEASE LIMITED | 67 |
| Top Fundamental | PWRD | PERFECT WORLD CO ADS | 44 |
| Top Tech. & Fund. | PWRD | PERFECT WORLD CO ADS | 44 |
Category |
Symbol |
Company Name |
Expected Gain1 |
|---|---|---|---|
| Best Overall | ANIK | Anika Therapeutics Inc | 78 |
| Top Technical | ANIK | Anika Therapeutics Inc | 78 |
| Top Fundamental | SMCI | SUPER MICRO COMPUTER | 74 |
| Top Tech. & Fund. | SMCI | SUPER MICRO COMPUTER | 74 |
If you received this newsletter from a friend and you would like to receive it regularly please go to the BreakoutWatch.com site and enter as a Guest. You will then be able to register to receive the newsletter.
Copyright © 2009 NBIcharts, LLC dba BreakoutWatch.com.
All rights reserved.
"
BreakoutWatch," the BreakoutWatch.com "eye" logo, and the
slogan "tomorrow's breakouts today" are service marks of NBIcharts
LLC. All other marks are the property of their respective owners, and are
used for descriptive purposes only.
BreakoutWatch is not affiliated with Investor's Business Daily or with Mr. William O'Neil.
Our site, research and analysis is supported entirely by subscription and is free from advertising.