| Market Summary | Weekly Breakout Report | Top Breakout Choices | Top 2nd Chances | New Features | Tip of the Week |
It is an oft-stated truism that the markets hate uncertainty and they received a double-whammy of the heebie-jeebies late this week. On Thursday, the Administration introduced some ill-defined constraints on the bank's ability to trade for their own account and on Friday Ben Bernanke's re-confirmation as Fed Chairmen seemed increasingly doubtful. In general, Wall Street is grateful for Bernanke's stewardship of the financial crisis, especially as it allowed them to make substantial profits by trading on cheap money provided by the Fed. Now that the Administration has moved to reflect populist anger towards the banks, any change at the head of the Fed could signal a less accommodating stance.
While these factors accelerated
the slide on Thursday and Friday, the
markets were already in a nervous state as earnings were generally below
estimates and world growth in 2010 is threatened by China's plans to
curtail growth and control inflation by stifling lending by the
nation's banks.
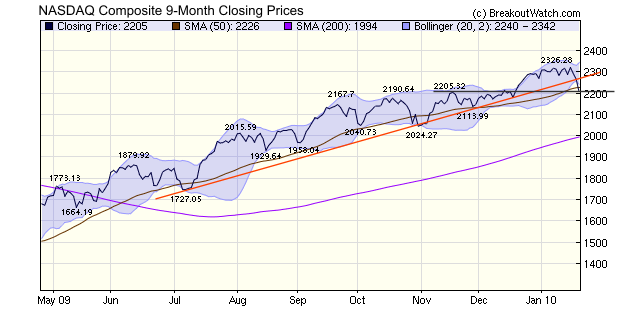
As usual we review prospects for
the NASDAQ as that market is the
incubator for most breakout stocks. The chart contains four harbingers
of more pain to come.The index has fallen
- through the lower bounds of its 9-month ascending trend line of closing prices
- lower than the 50 day moving average
- outside the lower Bollinger band by a substantial margin not seen since the March, 2009 bottom.
Market turbulence has a history of
either subsiding or worsening over the weekend so we make no
predictions as to what Monday will bring.
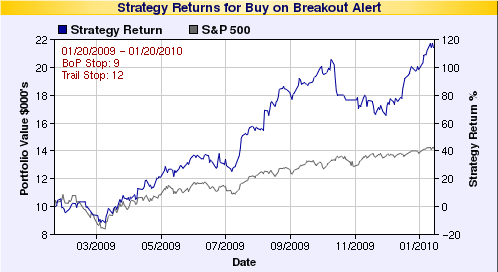
We have updated our Zacks strategy backtest tool to include the latest available data and also put in place a process to update the backtest data base on a daily basis going forward. The default parameters for the tool have been adjusted to show the most recent 12 months of data.
Over the last 12 months, using the strategy with a buy on alert and a 8% stop loss on that alert price would have yielded a 48% return (as of writing 1/20/2010). However, using a trailing stop of 12% would have yielded a return of 70%. The best return of 114% would have been obtained with 9% stop and 12% trailing stop.
To use our Zacks Strategy you must first subscribe to Zacks. You can get a free trial by clicking their logo. We are not affiliated with Zacks, but we do get a commission on on any referrals, so please click this link.
A subscriber has suggested porting
this backtest tool to work with all our data, not just Zacks Rank 1 stocks, and we are in the process of doing so.
Our investigation of the factors that contribute to a viable breakout from a cup-with-handle chart pattern have generated a good deal of interest. This week we heard from a subscriber who only considers breakouts with an RS Rank level of 99 but after reading last weeks analysis is considering switching to considering RS Rank levels of 91 or above.
Now with just 1.7% of breakouts having an RS Rank of 99 its possible that he could be missing a lot of opportunities. On the other hand it may be that the stocks with an RS Rank of 99 have a much lower failure rate than those ranked 91 or more and may give a better overall return. To resolve this, we wanted to analyze in more detail the performance of those stocks ranked 91 or better.
While doing so, we discovered late on Friday afternoon that the data set on which we were doing the analysis was incomplete and needed to be re-extracted. Handling these large volumes of data is time consuming and we couldn't complete the extraction in time to do a meaningful analysis before the weekend, so we will have to resume our analysis next week.
I don't expect the missing data to have a material affect on the results but it is better to be sure.
I know this is frustrating to our subscribers as it is to me, but researchers often find errors in their experimental methods and have to begin again and I'm sure you would prefer to have confidence in the results.
| Index | Value | Change Week | Change YTD | Trend | ||||||||||||||||||||||||||||||||||||
|---|---|---|---|---|---|---|---|---|---|---|---|---|---|---|---|---|---|---|---|---|---|---|---|---|---|---|---|---|---|---|---|---|---|---|---|---|---|---|---|---|
| Dow | 10173 | -4.12% | -2.45% | Up | ||||||||||||||||||||||||||||||||||||
| NASDAQ | 2205.29 | -3.61% | -2.81% | Up | ||||||||||||||||||||||||||||||||||||
| S&P 500 | 1091.76 | -3.9% | -2.09% | Up | ||||||||||||||||||||||||||||||||||||
| Russell 2000 | 617.12 | -3.27% | -2.67% | Up | ||||||||||||||||||||||||||||||||||||
| Wilshire 5000 | 11289.1 | -3.64% | -1.81% | Up | ||||||||||||||||||||||||||||||||||||
1The Market Signal is derived
from our proprietary market model. The market model is described on the
site.
2The site also shows industry rankings based on fundamentals, combined technical and fundamentals, and on price alone. The site also shows daily industry movements. |
||||||||||||||||||||||||||||||||||||||||
|
# of Breakouts
|
Period Average1
|
Max. Gain During Period2
|
Gain at Period Close3
|
|
|---|---|---|---|---|
| This Week | 5 | 11.31 | 3.4% | -3.06% |
| Last Week | 25 | 11.23 | 9.92% | 0.83% |
| 13 Weeks | 162 | 11.85 | 14.86% |
-0.27% |
2This represents the return if each stock were bought at its breakout price and sold at its intraday high.
3This represents the return if each stock were bought at its breakout price and sold at the most recent close.
|
Category
|
Symbol
|
Company Name
|
Expected Gain1
|
|---|---|---|---|
| Best Overall | BLC | Belo Corp. | 109 |
| Top Technical | DNH | WisdomTree Pacific ex-Japan Equity Inc | 22 |
| Top Fundamental | PEGA | Pegasystems Inc. | 49 |
| Top Tech. & Fund. | VIT | VanceInfo Technologies Inc. | 66 |
|
Category
|
Symbol
|
Company Name
|
Expected Gain1
|
|---|---|---|---|
| Best Overall | CDR | Cedar Shopping Centers Inc. | 107 |
| Top Technical | CDR | Cedar Shopping Centers Inc. | 107 |
| Top Fundamental | CDR | Cedar Shopping Centers Inc. | 107 |
| Top Tech. & Fund. | CDR | Cedar Shopping Centers Inc. | 107 |
If you received this newsletter from a friend and you would like to receive it regularly please go to the BreakoutWatch.com site and enter as a Guest. You will then be able to register to receive the newsletter.
Copyright © 2010 NBIcharts, LLC dba BreakoutWatch.com. All
rights reserved.
" BreakoutWatch," the BreakoutWatch.com "eye" logo, and the slogan
"tomorrow's breakouts today" are service marks of NBIcharts LLC. All
other marks are the property of their respective owners, and are used
for descriptive purposes only.
BreakoutWatch is not affiliated with Investor's Business Daily
or with Mr. William O'Neil.
Our site, research and analysis is supported entirely by subscription
and is free from advertising.