| Market Summary | Weekly Breakout Report | Top Breakout Choices | Top 2nd Chances | New Features | Tip of the Week |
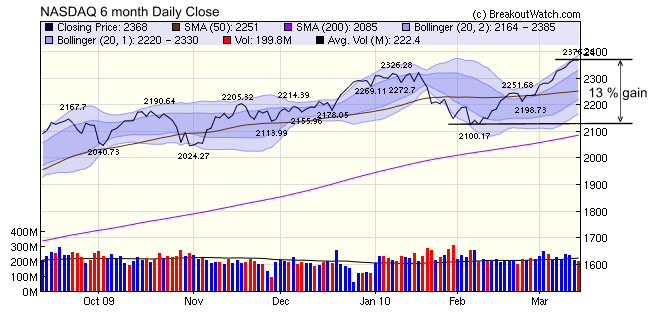
At week's end, the NASDAQ Composite closed 4.3% higher for the year surpassed only by the Russell 2000 which gained 6.7%. Friday's close left the NASDAQ with its first loss in seven sessions but that still left it 13% higher than its February 5 low. We see from the chart that it has tracked close to its 2 standard deviation Bollinger band for the last two weeks and while such an extended run has been seen several times in the last year, it looks as though we are in for another period of consolidation now.
We added our 'thumbs up'  indicator to our daily email and also to our 'recent breakouts' report this week. Stocks earn this symbol when they meet the target criteria we have established recently.See Factors Affecting Performance After Breakout. This symbol has already been added to our daily alert monitors.
We also made a slight modification to our new CwH Backtest Tool so that the 'Buy Limit as % of BoP' will apply to the 'Buy on Alert' option. This was done to avoid buying takeover candidates which could show a large gain on breakout day.
Now that the CwH backtest tool is complete, we can start some rigorous investigation of the factors that lead to selection of successful breakouts. We have the ability to automate the testing of many scenarios through the simulator and this week we looked at the level of breakout day volume which gave the best return after breakout.
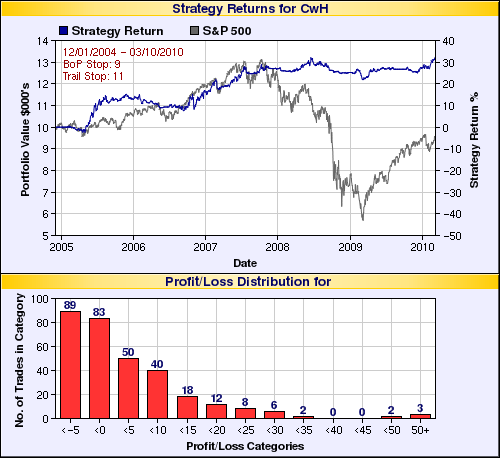
If you read our Factors Affecting Performance After Breakout then you might recall that we found that volumes above 2.25 times the 50 day average volume were more likely to give returns of 25% or more. To confirm this value we ran a series of simulations going back to 2004 with required breakout day volume to average volume ratios of from 1 to 5. We also varied the stop loss below BoP factors and trailing stop factors. To minimize the effects of the sequence in which stocks were bought (see last weeks newsletter for an explanation) we used a portfolio size of 20 stocks.
The best returns were obtained when buying on breakout alert when the volume to average volume ratio was exactly 3, selling if the price fell to 8% below the BoP, or selling with a trailing stop of 11%. Here's the chart of returns. Notice how a portfolio size of 20 stocks prevented major losses since October 2008 - evidence of the benefits of diversification!
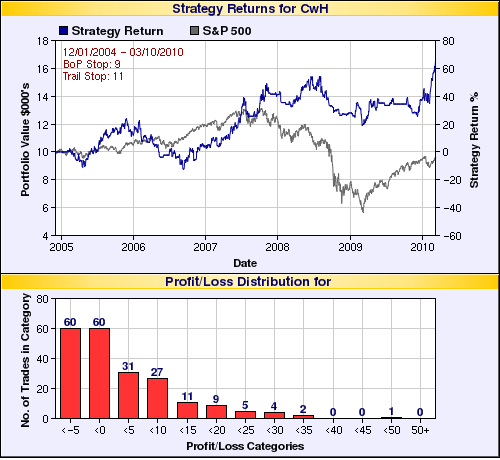
If we limit our portfolio to 4 positions, we get almost double the return, but with more volatility.
You can verify these results and experiment with your own parameters on our web site. Go to the Evaluate > Analytical Tools > CwH Backtest menu choice
| Index | Value | Change Week | Change YTD | Trend | ||||||||||||||||||||||||||||||||||||
|---|---|---|---|---|---|---|---|---|---|---|---|---|---|---|---|---|---|---|---|---|---|---|---|---|---|---|---|---|---|---|---|---|---|---|---|---|---|---|---|---|
| Dow | 10624.7 | 0.55% | 1.89% | Up | ||||||||||||||||||||||||||||||||||||
| NASDAQ | 2367.66 | 1.78% | 4.34% | Up | ||||||||||||||||||||||||||||||||||||
| S&P 500 | 1149.99 | 0.99% | 3.13% | Up | ||||||||||||||||||||||||||||||||||||
| Russell 2000 | 676.58 | 1.59% | 6.7% | Up | ||||||||||||||||||||||||||||||||||||
| Wilshire 5000 | 11984.2 | 1.16% | 4.23% | Up | ||||||||||||||||||||||||||||||||||||
1The Market Signal is derived from our proprietary
market model. The market model is described on the site. 2The site also shows industry rankings based on fundamentals, combined technical and fundamentals, and on price alone. The site also shows daily industry movements. |
||||||||||||||||||||||||||||||||||||||||
# of Breakouts |
Period Average1 |
Max. Gain During Period2 |
Gain at Period Close3 |
|
|---|---|---|---|---|
| This Week | 23 | 15.54 | 7.04% | 3.88% |
| Last Week | 39 | 13.92 | 9.93% | 6.87% |
| 13 Weeks | 229 | 15.85 | 13.7% |
6.98% |
2This represents the return if each stock were bought at its breakout price and sold at its intraday high.
3This represents the return if each stock were bought at its breakout price and sold at the most recent close.
Category |
Symbol |
Company Name |
Expected Gain1 |
|---|---|---|---|
| Best Overall | WILC | G. Willi Food-International Ltd. | 114 |
| Top Technical | JAZZ | Jazz Pharmaceuticals, Inc. | 86 |
| Top Fundamental | CAAS | China Automotive Systems Inc. | 75 |
| Top Tech. & Fund. | CTEL | City Telecom HK Ltd. | 81 |
Category |
Symbol |
Company Name |
Expected Gain1 |
|---|---|---|---|
| Best Overall | MEA | Metalico Inc. | 110 |
| Top Technical | CVVT | China Valves Technology, Inc. | 78 |
| Top Fundamental | HITK | Hi Tech Pharmacal Co. Inc. | 70 |
| Top Tech. & Fund. | NUS | Nu Skin Enterprises Inc. | 54 |
If you received this newsletter from a friend and you would like to receive it regularly please go to the BreakoutWatch.com site and enter as a Guest. You will then be able to register to receive the newsletter.
Copyright © 2010 NBIcharts, LLC dba BreakoutWatch.com.
All rights reserved.
"
BreakoutWatch," the BreakoutWatch.com "eye" logo, and the
slogan "tomorrow's breakouts today" are service marks of NBIcharts
LLC. All other marks are the property of their respective owners, and are
used for descriptive purposes only.
BreakoutWatch is not affiliated with Investor's Business Daily or with Mr. William O'Neil.
Our site, research and analysis is supported entirely by subscription and is free from advertising.