| Market Summary | Weekly Breakout Report | Top Breakout Choices | Top 2nd Chances | New Features | Tip of the Week |
The correction we expected occurred this week as the Goldman Sachs investigations accelerated and the Eurozone failed to act decisively to address the debt problems of Greece. The correction came despite an earnings season for the record books and an improving economic picture.
The NASDAQ Composite completed a bearish Head and Shoulders Top pattern on Friday. 'Completion' occurs when the stock passes through the neckline (a line drawn through the lows between the two shoulders).
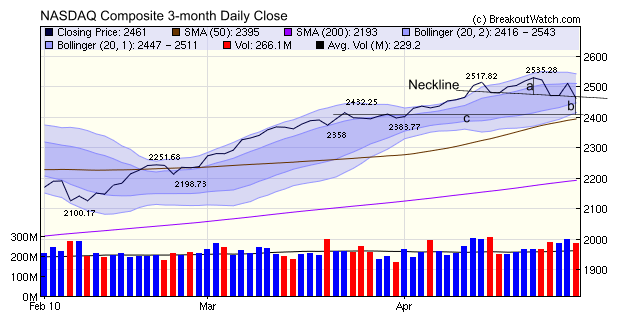
To determine the target loss after completion of the pattern, we measure the difference between the head and the neckline 9a) and then subtract it from the point where the price crosses the neckline(b). We find that this gives us a target very similar to the former resistance line at 2432 (c). Once passed, resistance becomes support, so we have two indicators that the index could fall to about 2430 before recovering. That is only 1.2% below Friday's close so we could expect a further decline on Monday with a late afternoon rally.
Weighing against this purely technical analysis is a deteriorating position in the Gulf as the oil spill threatens and the price of oil moves up in reaction to possible tighter drilling controls. Furthermore, although a Greek rescue plan is due to be completed by Sunday, massive street demonstrations will undoubtedly result and the Greek Government's resolve to implement severe austerity measures in the face of massive domestic revolt will continue to unbalance the financial markets.
Last week we sought your guidance and the question was, given the limitations of volume data, should we send alerts on price alone?
The verdict is in: yes, send alerts on price alone.
Beginning Monday, we will send alerts as soon as a stock rises to its breakout price (long positions) or falls to its breakdown price (short positions). The alerts will include a note reminding you that volume has not been taken into consideration.
Included in each alert will be a link to Google Finance for the particular stock. There you can track the price in real time, compare it to other stocks in the same industry group and read the latest news on the company.
| Index | Value | Change Week | Change YTD | Trend | ||||||||||||||||||||||||||||||||||||
|---|---|---|---|---|---|---|---|---|---|---|---|---|---|---|---|---|---|---|---|---|---|---|---|---|---|---|---|---|---|---|---|---|---|---|---|---|---|---|---|---|
| Dow | 11008.6 | -1.75% | 5.57% | Up | ||||||||||||||||||||||||||||||||||||
| NASDAQ | 2461.19 | -2.73% | 8.46% | Up | ||||||||||||||||||||||||||||||||||||
| S&P 500 | 1186.68 | -2.51% | 6.42% | Up | ||||||||||||||||||||||||||||||||||||
| Russell 2000 | 716.6 | -3.41% | 13.02% | Up | ||||||||||||||||||||||||||||||||||||
| Wilshire 5000 | 12408.8 | -2.64% | 7.93% | Up | ||||||||||||||||||||||||||||||||||||
1The Market Signal is derived from our proprietary
market model. The market model is described on the site. 2The site also shows industry rankings based on fundamentals, combined technical and fundamentals, and on price alone. The site also shows daily industry movements. |
||||||||||||||||||||||||||||||||||||||||
# of Breakouts |
Period Average1 |
Max. Gain During Period2 |
Gain at Period Close3 |
|
|---|---|---|---|---|
| This Week | 17 | 17.31 | 8.82% | 3.71% |
| Last Week | 23 | 16.62 | 8.35% | -1.24% |
| 13 Weeks | 247 | 18 | 19.98% |
9.03% |
2This represents the return if each stock were bought at its breakout price and sold at its intraday high.
3This represents the return if each stock were bought at its breakout price and sold at the most recent close.
Category |
Symbol |
Company Name |
Expected Gain1 |
|---|---|---|---|
| Best Overall | JASO | JA Solar Holdings Co., Ltd. | 117 |
| Top Technical | STBA | S&T Bancorp Inc. | 58 |
| Top Fundamental | CAAS | China Automotive Systems Inc. | 72 |
| Top Tech. & Fund. | CAAS | China Automotive Systems Inc. | 72 |
Category |
Symbol |
Company Name |
Expected Gain1 |
|---|---|---|---|
| Best Overall | SPRD | Spreadtrum Communications Inc. | 111 |
| Top Technical | SOL | ReneSola Ltd. | 95 |
| Top Fundamental | JOBS | 51job Inc. | 56 |
| Top Tech. & Fund. | GSIT | GSI Technology Inc. | 108 |
If you received this newsletter from a friend and you would like to receive it regularly please go to the BreakoutWatch.com site and enter as a Guest. You will then be able to register to receive the newsletter.
Copyright © 2010 NBIcharts, LLC dba BreakoutWatch.com.
All rights reserved.
"
BreakoutWatch," the BreakoutWatch.com "eye" logo, and the
slogan "tomorrow's breakouts today" are service marks of NBIcharts
LLC. All other marks are the property of their respective owners, and are
used for descriptive purposes only.
BreakoutWatch is not affiliated with Investor's Business Daily or with Mr. William O'Neil.
Our site, research and analysis is supported entirely by subscription and is free from advertising.