| Market Summary | Weekly Breakout Report | Top Breakout Choices | Top 2nd Chances | New Features | Tip of the Week |
The markets fell like water over Niagara Falls this week as our chart of the NASDAQ Composite shows. The index has corrected 10.6% since the intraday high on April 26. With the Greek debt crisis still unresolved the markets are extremely volatile and easily spooked. The IMF Executive Board meets on Sunday to review Greece's request for a 30 Billion Euro credit facility and Common Market leaders meet on Monday to approve a 110 billion Euro 3-year loan. If the European debt crisis is not resolved by the time the markets open on Monday, there is the potential for the index to test the lows of last December and February which would represent a correction of 17%, just short of signaling a new bear market.
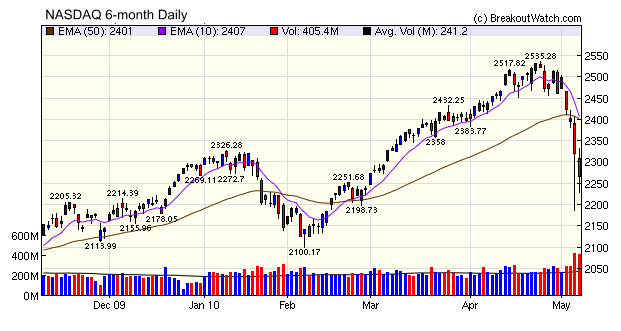
The Russell 2000 and Wilshire 5000 are the only major indexes to have held onto a small gain for the year. As of Friday's close, our market indicators were still showing a positive trend but the NASDAQ chart shows that the trend is on the cusp of reversal. Our NASDAQ trend is determined using the crossover of the 10 and 50 day exponential moving averages and as you can see, the crossover is about to occur if the sell-off continues.
With the markets in steep decline, the number of breakouts fell to a meager 8 this week, but they did close for a positive gain, on average, no mean feat in such a terrible market.
We are now sending out alerts based solely on a stock meeting its break out (or break down) price. Projected daily volume is no longer a factor. However, we are still reporting a breakout as confirmed if the price holds above the breakout price and average volume is at least 1.5 times the 50 day average.
The action on Thursday and Friday may be indicative of capitulation but it would be wise to wait for a reversal (a close higher than the open after a new intraday low) before taking any new long positions.
| Index | Value | Change Week | Change YTD | Trend | ||||||||||||||||||||||||||||||||||||
|---|---|---|---|---|---|---|---|---|---|---|---|---|---|---|---|---|---|---|---|---|---|---|---|---|---|---|---|---|---|---|---|---|---|---|---|---|---|---|---|---|
| Dow | 10380.4 | -5.71% | -0.46% | Up | ||||||||||||||||||||||||||||||||||||
| NASDAQ | 2265.64 | -7.95% | -0.15% | Up | ||||||||||||||||||||||||||||||||||||
| S&P 500 | 1110.88 | -6.39% | -0.38% | Up | ||||||||||||||||||||||||||||||||||||
| Russell 2000 | 653 | -8.88% | 2.99% | Up | ||||||||||||||||||||||||||||||||||||
| Wilshire 5000 | 11560 | -6.84% | 0.54% | Up | ||||||||||||||||||||||||||||||||||||
1The Market Signal is derived from our proprietary
market model. The market model is described on the site. 2The site also shows industry rankings based on fundamentals, combined technical and fundamentals, and on price alone. The site also shows daily industry movements. |
||||||||||||||||||||||||||||||||||||||||
# of Breakouts |
Period Average1 |
Max. Gain During Period2 |
Gain at Period Close3 |
|
|---|---|---|---|---|
| This Week | 8 | 17.69 | 10.88% | 1.16% |
| Last Week | 18 | 17.31 | 10.31% | -3.41% |
| 13 Weeks | 240 | 18.23 | 20.88% |
-2.07% |
2This represents the return if each stock were bought at its breakout price and sold at its intraday high.
3This represents the return if each stock were bought at its breakout price and sold at the most recent close.
Category |
Symbol |
Company Name |
Expected Gain1 |
|---|---|---|---|
| Best Overall | THM | International Tower Hill Mines Ltd. | 106 |
| Top Technical | SWWC | Southwest Water Co. | 55 |
| Top Fundamental | NEOG | Neogen Corp. | 46 |
| Top Tech. & Fund. | MED | Medifast Inc. | 73 |
Category |
Symbol |
Company Name |
Expected Gain1 |
|---|---|---|---|
| Best Overall | EGO | Eldorado Gold Corp. | 76 |
| Top Technical | EGO | Eldorado Gold Corp. | 76 |
| Top Fundamental | EGO | Eldorado Gold Corp. | 76 |
| Top Tech. & Fund. | EGO | Eldorado Gold Corp. | 76 |
If you received this newsletter from a friend and you would like to receive it regularly please go to the BreakoutWatch.com site and enter as a Guest. You will then be able to register to receive the newsletter.
Copyright © 2010 NBIcharts, LLC dba BreakoutWatch.com.
All rights reserved.
"
BreakoutWatch," the BreakoutWatch.com "eye" logo, and the
slogan "tomorrow's breakouts today" are service marks of NBIcharts
LLC. All other marks are the property of their respective owners, and are
used for descriptive purposes only.
BreakoutWatch is not affiliated with Investor's Business Daily or with Mr. William O'Neil.
Our site, research and analysis is supported entirely by subscription and is free from advertising.