| Market Summary | Weekly Breakout Report | Top Breakout Choices | Top 2nd Chances | New Features | Tip of the Week |
The major indexes
made solid gains for the week but on low volume and high volatility -
not a good investment climate for the individual investor.
Friday brought news that May retails sales were down by 1.2% which reminded me of last weeks chart that I showed you from the Consumer Metrics Institute. Based on consumer sales data they are predicting a recession in the third quarter and Friday's data gives additional weight to that view.
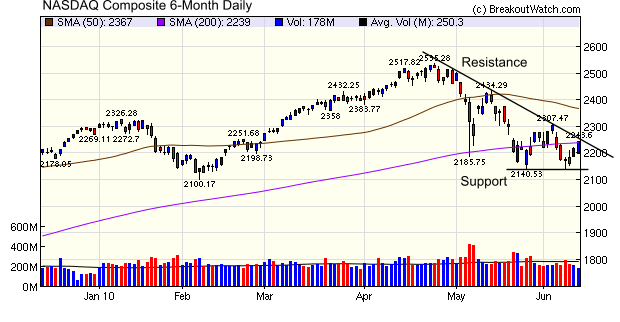
The NASDAQ Composite gained 1.1% for the week and closed right on its 50 day moving average. It thus faces two lines of resistance, the psychologically important 50 dma and the downward trend line. A breakout above 2310 would be bullish but the index could also test support at 2140. A breakdown below that level would continue the bearish trend.
Friday brought news that May retails sales were down by 1.2% which reminded me of last weeks chart that I showed you from the Consumer Metrics Institute. Based on consumer sales data they are predicting a recession in the third quarter and Friday's data gives additional weight to that view.
The NASDAQ Composite gained 1.1% for the week and closed right on its 50 day moving average. It thus faces two lines of resistance, the psychologically important 50 dma and the downward trend line. A breakout above 2310 would be bullish but the index could also test support at 2140. A breakdown below that level would continue the bearish trend.
I found the following video immensely amusing and hope you will too:
No new features this
week
A Comparison of Two
Strategies
Following on from our work over the past few weeks, I have prepared a page which puts our 'Buy on Alert' and 'Buy on Confirmed Breakout' side by side. You can see the page here.
I have also written an explanation of the inner workings of the backtest simulation that lies behind the strategies and you can read that at Backtest Methodology.
| Index | Value | Change Week | Change YTD | Trend | ||||||||||||||||||||||||||||||||||||
|---|---|---|---|---|---|---|---|---|---|---|---|---|---|---|---|---|---|---|---|---|---|---|---|---|---|---|---|---|---|---|---|---|---|---|---|---|---|---|---|---|
| Dow | 10211.1 | 2.81% | -2.08% | Up | ||||||||||||||||||||||||||||||||||||
| NASDAQ | 2243.6 | 1.1% | -1.13% | Down | ||||||||||||||||||||||||||||||||||||
| S&P 500 | 1091.6 | 2.51% | -2.11% | Up | ||||||||||||||||||||||||||||||||||||
| Russell 2000 | 649 | 2.37% | 2.35% | Down | ||||||||||||||||||||||||||||||||||||
| Wilshire 5000 | 11400 | 2.5% | -0.85% | Up | ||||||||||||||||||||||||||||||||||||
1The Market Signal is derived
from our proprietary market model. The market model is described on the
site.
2The site also shows industry rankings based on fundamentals, combined technical and fundamentals, and on price alone. The site also shows daily industry movements. |
||||||||||||||||||||||||||||||||||||||||
|
# of Breakouts
|
Period Average1
|
Max. Gain During Period2
|
Gain at Period Close3
|
|
|---|---|---|---|---|
| This Week | 4 | 12.54 | 3.9% | 1.89% |
| Last Week | 3 | 14.15 | 6.05% | -0.4% |
| 13 Weeks | 174 | 14.46 | 15.4% |
-7.21% |
2This represents the return if each stock were bought at its breakout price and sold at its intraday high.
3This represents the return if each stock were bought at its breakout price and sold at the most recent close.
|
Category
|
Symbol
|
Company Name
|
Expected Gain1
|
|---|---|---|---|
| Best Overall | JBLU | JetBlue Airways Corporation | 102 |
| Top Technical | ASPS | Altisource Portfolio Solutions S.A. | 37 |
| Top Fundamental | MED | Medifast Inc. | 67 |
| Top Tech. & Fund. | LULU | Lululemon Athletica Inc. | 42 |
|
Category
|
Symbol
|
Company Name
|
Expected Gain1
|
|---|---|---|---|
| Best Overall | LOOP | LoopNet, Inc. | 63 |
| Top Technical | LOOP | LoopNet, Inc. | 63 |
| Top Fundamental | MELI | Mercadolibre, Inc. | 44 |
| Top Tech. & Fund. | MELI | Mercadolibre, Inc. | 44 |
If you received this newsletter from a friend and you would like to receive it regularly please go to the BreakoutWatch.com site and enter as a Guest. You will then be able to register to receive the newsletter.
Copyright © 2010 NBIcharts, LLC dba BreakoutWatch.com.
All rights reserved.
" BreakoutWatch," the BreakoutWatch.com "eye" logo, and the slogan
"tomorrow's breakouts today" are service marks of NBIcharts LLC. All
other marks are the property of their respective owners, and are used
for descriptive purposes only.
BreakoutWatch is not affiliated with Investor's Business Daily
or with Mr. William O'Neil.
Our site, research and analysis is supported entirely by subscription
and is free from advertising.