| Market Summary | Weekly Breakout Report | Top Breakout Choices | Top 2nd Chances | New Features | Tip of the Week |
Firstly, we wish all our readers a happy and safe 4th of July weekend and hope that the market blues won't spoil your party.
For market blues there are a plenty as we see that the major indexes all lost heavily this week. We pointed to the beginning of a major correction on May 1 when we noted the NASDAQ Composite had completed a head and shoulders top and it was joined this week by the S&P 500 (see chart). In addition, our market trend indicator for the S&P 500 turned south on Thursday and the 50 day moving average is crossing the 200 day moving average at Friday's close.
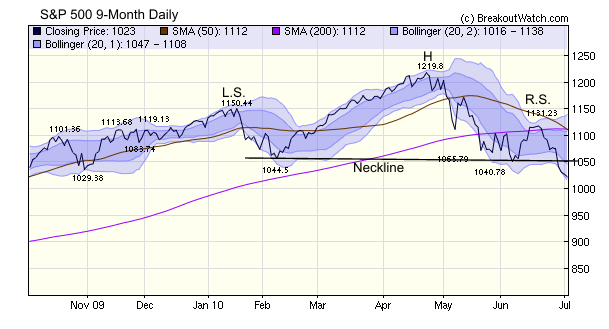
As regular readers know, the head and shoulders top is a bearish pattern, and one of the more reliable ones. The pattern suggests that the S&P 500 could fall a further 160 or so points to around the 900 level. We get this estimate by taking the drop from the head to the neckline and then subtracting it from the point where the neckline crosses the closing price line. This would be a 26% correction from the high of 1219 and place us well into bear market territory.
For market blues there are a plenty as we see that the major indexes all lost heavily this week. We pointed to the beginning of a major correction on May 1 when we noted the NASDAQ Composite had completed a head and shoulders top and it was joined this week by the S&P 500 (see chart). In addition, our market trend indicator for the S&P 500 turned south on Thursday and the 50 day moving average is crossing the 200 day moving average at Friday's close.
As regular readers know, the head and shoulders top is a bearish pattern, and one of the more reliable ones. The pattern suggests that the S&P 500 could fall a further 160 or so points to around the 900 level. We get this estimate by taking the drop from the head to the neckline and then subtracting it from the point where the neckline crosses the closing price line. This would be a 26% correction from the high of 1219 and place us well into bear market territory.
No new features, but we did correct a couple of bugs.
1. Under certain circumstances, the menu was disappearing and that has been corrected.
2. Related to the same bug, the watchlist displays were sometimes reverting to the old display and filter values were apparently disappearing. That is also fixed.
1. Under certain circumstances, the menu was disappearing and that has been corrected.
2. Related to the same bug, the watchlist displays were sometimes reverting to the old display and filter values were apparently disappearing. That is also fixed.
This feature will return next week.
| Index | Value | Change Week | Change YTD | Trend | ||||||||||||||||||||||||||||||||||||
|---|---|---|---|---|---|---|---|---|---|---|---|---|---|---|---|---|---|---|---|---|---|---|---|---|---|---|---|---|---|---|---|---|---|---|---|---|---|---|---|---|
| Dow | 9686.48 | -4.51% | -7.11% | Up | ||||||||||||||||||||||||||||||||||||
| NASDAQ | 2091.79 | -5.92% | -7.82% | Down | ||||||||||||||||||||||||||||||||||||
| S&P 500 | 1022.58 | -5.03% | -8.3% | Down | ||||||||||||||||||||||||||||||||||||
| Russell 2000 | 598.97 | -7.15% | -5.54% | Down | ||||||||||||||||||||||||||||||||||||
| Wilshire 5000 | 10654.1 | -5.32% | -7.34% | Up | ||||||||||||||||||||||||||||||||||||
1The Market Signal is derived from our proprietary
market model. The market model is described on the site. 2The site also shows industry rankings based on fundamentals, combined technical and fundamentals, and on price alone. The site also shows daily industry movements. |
||||||||||||||||||||||||||||||||||||||||
# of Breakouts |
Period Average1 |
Max. Gain During Period2 |
Gain at Period Close3 |
|
|---|---|---|---|---|
| This Week | 4 | 9.31 | 3.55% | 1.22% |
| Last Week | 10 | 9.08 | 5.27% | -3.66% |
| 13 Weeks | 137 | 9.77 | 12.48% |
-11.51% |
2This represents the return if each stock were bought at its breakout price and sold at its intraday high.
3This represents the return if each stock were bought at its breakout price and sold at the most recent close.
Category |
Symbol |
Company Name |
Expected Gain1 |
|---|---|---|---|
| Best Overall | AEZ | American Oil & Gas Inc. | 111 |
| Top Technical | GRNB | Green Bankshares, Inc. | 61 |
| Top Fundamental | NGLS | Targa Resources Partners LP | 47 |
| Top Tech. & Fund. | SWKS | Skyworks Solutions Inc. | 61 |
Category |
Symbol |
Company Name |
Expected Gain1 |
|---|---|---|---|
| Best Overall | LOOP | LoopNet, Inc. | 64 |
| Top Technical | LOOP | LoopNet, Inc. | 64 |
| Top Fundamental | VGR | Vector Group Ltd. | 46 |
| Top Tech. & Fund. | LOOP | LoopNet, Inc. | 64 |
If you received this newsletter from a friend and you would like to receive it regularly please go to the BreakoutWatch.com site and enter as a Guest. You will then be able to register to receive the newsletter.
Copyright © 2010 NBIcharts, LLC dba BreakoutWatch.com.
All rights reserved.
"
BreakoutWatch," the BreakoutWatch.com "eye" logo, and the
slogan "tomorrow's breakouts today" are service marks of NBIcharts
LLC. All other marks are the property of their respective owners, and are
used for descriptive purposes only.
BreakoutWatch is not affiliated with Investor's Business Daily or with Mr. William O'Neil.
Our site, research and analysis is supported entirely by subscription and is free from advertising.