| Market Summary | Weekly Breakout Report | Top Breakout Choices | Top 2nd Chances | New Features | Tip of the Week |
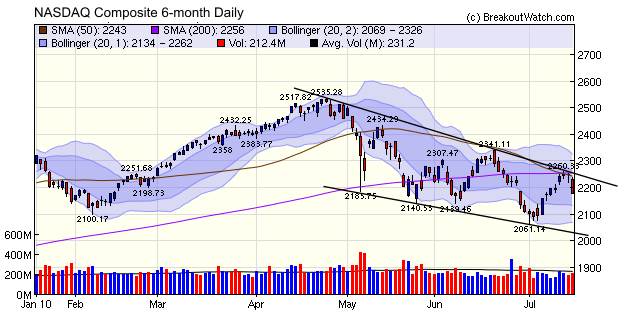
Last week we analyzed the nascent rally and found several technical reasons to doubt it would hold. As the rally continued at the start of the week, we began to doubt our assessment but now we can say that the rally has failed with all the major indexes coming under distribution on Friday with losses in the vicinity of 3%. As the daily NASDAQ Composite chart shows, the downward trend line of lower highs was respected and we could now see a test of support at the 2140 level and if that fails, a further test of support at 2060. The trend of lower lows is ominous and that is one trend line we hope will not be respected.
Consumer confidence is falling so the consumer is unlikely to spend. As two-thirds of GDP depends on consumer spending it is likely that we will see GDP falling in the second half of this year with a consequently negative impact on earnings and stock prices. We may have to wait until October, or even after the election before the next bottom is reached.
No new features this week.
This feature will return after the school vacation.
| Index | Value | Change Week | Change YTD | Trend | ||||||||||||||||||||||||||||||||||||
|---|---|---|---|---|---|---|---|---|---|---|---|---|---|---|---|---|---|---|---|---|---|---|---|---|---|---|---|---|---|---|---|---|---|---|---|---|---|---|---|---|
| Dow | 10097.9 | -0.98% | -3.17% | Up | ||||||||||||||||||||||||||||||||||||
| NASDAQ | 2179.05 | -0.79% | -3.97% | Down | ||||||||||||||||||||||||||||||||||||
| S&P 500 | 1064.88 | -1.21% | -4.5% | Down | ||||||||||||||||||||||||||||||||||||
| Russell 2000 | 610.39 | -3.02% | -3.73% | Down | ||||||||||||||||||||||||||||||||||||
| Wilshire 5000 | 11066.6 | -1.42% | -3.75% | Down | ||||||||||||||||||||||||||||||||||||
1The Market Signal is derived from our proprietary
market model. The market model is described on the site. 2The site also shows industry rankings based on fundamentals, combined technical and fundamentals, and on price alone. The site also shows daily industry movements. |
||||||||||||||||||||||||||||||||||||||||
# of Breakouts |
Period Average1 |
Max. Gain During Period2 |
Gain at Period Close3 |
|
|---|---|---|---|---|
| This Week | 7 | 7.31 | 4.57% | 1.05% |
| Last Week | 5 | 8.23 | 4.36% | 0.36% |
| 13 Weeks | 104 | 8.85 | 15.37% |
-3.37% |
2This represents the return if each stock were bought at its breakout price and sold at its intraday high.
3This represents the return if each stock were bought at its breakout price and sold at the most recent close.
Category |
Symbol |
Company Name |
Expected Gain1 |
|---|---|---|---|
| Best Overall | GGAL | Grupo Financiero Galicia S.A. | 120 |
| Top Technical | ACTG | Acacia Research Corporation | 57 |
| Top Fundamental | CBD | Companhia Brasileira de Distribuicao | 41 |
| Top Tech. & Fund. | MEND | Micrus Endovascular Corp. | 42 |
Category |
Symbol |
Company Name |
Expected Gain1 |
|---|---|---|---|
| Best Overall | EZCH | EZchip Semiconductor Ltd. | 65 |
| Top Technical | MEND | Micrus Endovascular Corp. | 58 |
| Top Fundamental | MEND | Micrus Endovascular Corp. | 58 |
| Top Tech. & Fund. | MEND | Micrus Endovascular Corp. | 58 |
If you received this newsletter from a friend and you would like to receive it regularly please go to the BreakoutWatch.com site and enter as a Guest. You will then be able to register to receive the newsletter.
Copyright © 2010 NBIcharts, LLC dba BreakoutWatch.com.
All rights reserved.
"
BreakoutWatch," the BreakoutWatch.com "eye" logo, and the
slogan "tomorrow's breakouts today" are service marks of NBIcharts
LLC. All other marks are the property of their respective owners, and are
used for descriptive purposes only.
BreakoutWatch is not affiliated with Investor's Business Daily or with Mr. William O'Neil.
Our site, research and analysis is supported entirely by subscription and is free from advertising.