| Market Summary | Weekly Breakout Report | Top Breakout Choices | Top 2nd Chances | New Features | Tip of the Week |
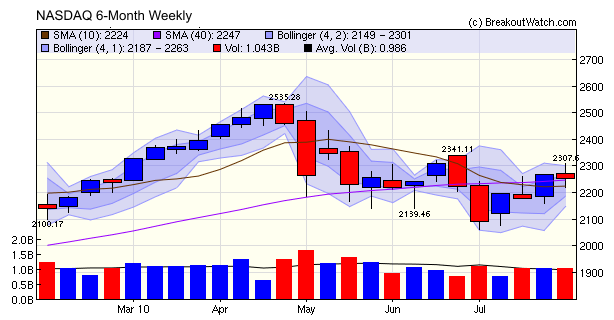
Just as the economy is sending mixed signals, so are the technical indicators. Our trend indicators for the NASDAQ and Russell 2000 reversed to "Up" this week but the weekly NASDAQ chart shows a "Doji" pattern that reflects a more or less equal balance between bulls and bears with the bias being with the bears. The anticipation of continued strong earnings reports which drove the indexes higher last week has now turned to fear that earnings in the next quarter will not meet expectations. We think this fear is justified, for reasons discussed below, and August will see a continued decline in the major indexes.
Friday's declining GDP figures and falling consumer confidence indicate that the recovery is not going well. Regular readers may recall that on 06/04/2010 I drew attention to the Consumer Metrics Institute growth index indicator that implied that GDP for the second half of the year could be of the order of -2%. Following the release of the second quarter GDP numbers on Friday they have published some analysis that suggests that a negative second half is indeed possible. Their key points are that
- Suppliers increased inventories in the first quarter more than
initially measured in anticipation of increasing consumer demand
accounting for the 1% upwards revision in GDP
- consumer demand was anemic in the second quarter and inventory build-up slowed
- weak consumer demand will lead to a cut back in inventories and a continuing fall in GDP
Of course the US GDP is but one component of the world economy and many US companies operate globally so there is not a direct correlation between US GDP and the stock markets. Many companies will continue to grow if the global recovery continues. There will continue to be breakout opportunities, although fewer of them as this weeks breakout numbers, compared to last weeks, show.
No new features this week.
This section will return at the end of August after the kids return to school.
| Index | Value | Change Week | Change YTD | Trend | ||||||||||||||||||||||||||||||||||||
|---|---|---|---|---|---|---|---|---|---|---|---|---|---|---|---|---|---|---|---|---|---|---|---|---|---|---|---|---|---|---|---|---|---|---|---|---|---|---|---|---|
| Dow | 10465.9 | 0.4% | 0.36% | Up | ||||||||||||||||||||||||||||||||||||
| NASDAQ | 2254.7 | -0.65% | -0.64% | Up | ||||||||||||||||||||||||||||||||||||
| S&P 500 | 1101.6 | -0.1% | -1.21% | Down | ||||||||||||||||||||||||||||||||||||
| Russell 2000 | 650.89 | 0.04% | 2.65% | Up | ||||||||||||||||||||||||||||||||||||
| Wilshire 5000 | 11492.9 | -0.13% | -0.04% | Up | ||||||||||||||||||||||||||||||||||||
1The Market Signal is derived from our proprietary
market model. The market model is described on the site. 2The site also shows industry rankings based on fundamentals, combined technical and fundamentals, and on price alone. The site also shows daily industry movements. |
||||||||||||||||||||||||||||||||||||||||
# of Breakouts |
Period Average1 |
Max. Gain During Period2 |
Gain at Period Close3 |
|
|---|---|---|---|---|
| This Week | 18 | 7.54 | 3.55% | 1.11% |
| Last Week | 22 | 7.54 | 8.82% | 5.06% |
| 13 Weeks | 101 | 8.92 | 14.44% |
4.38% |
2This represents the return if each stock were bought at its breakout price and sold at its intraday high.
3This represents the return if each stock were bought at its breakout price and sold at the most recent close.
Category |
Symbol |
Company Name |
Expected Gain1 |
|---|---|---|---|
| Best Overall | RQI | Cohen & Steers Quality Income Realty Fund Inc. | 115 |
| Top Technical | NR | Newpark Resources Inc. | 98 |
| Top Fundamental | MED | Medifast Inc. | 56 |
| Top Tech. & Fund. | FNSR | Finisar Corp. | 62 |
Category |
Symbol |
Company Name |
Expected Gain1 |
|---|---|---|---|
| Best Overall | BJGP | BMP Sunstone Corporation | 97 |
| Top Technical | EZCH | EZchip Semiconductor Ltd. | 63 |
| Top Fundamental | EZCH | EZchip Semiconductor Ltd. | 63 |
| Top Tech. & Fund. | EZCH | EZchip Semiconductor Ltd. | 63 |
If you received this newsletter from a friend and you would like to receive it regularly please go to the BreakoutWatch.com site and enter as a Guest. You will then be able to register to receive the newsletter.
Copyright © 2010 NBIcharts, LLC dba BreakoutWatch.com.
All rights reserved.
"
BreakoutWatch," the BreakoutWatch.com "eye" logo, and the
slogan "tomorrow's breakouts today" are service marks of NBIcharts
LLC. All other marks are the property of their respective owners, and are
used for descriptive purposes only.
BreakoutWatch is not affiliated with Investor's Business Daily or with Mr. William O'Neil.
Our site, research and analysis is supported entirely by subscription and is free from advertising.