| Market Summary | Weekly Breakout Report | Top Breakout Choices | Top 2nd Chances | New Features | Tip of the Week |
The
NASDAQ Composite comfortably broke through resistance at 2309 to close
the week at 2315. This is significant because it failed to pierce
resistance at this level in August. It faces its next test at 2341. The
NASDAQ was the strongest performing index as technology companies are
expected to benefit most as the recovery gathers pace.
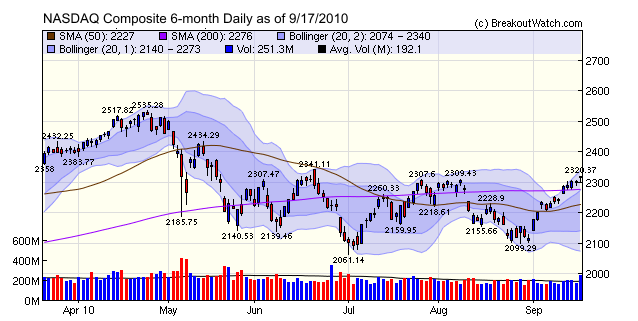
The chart shows a volume spike on Friday but this was due to Friday being a 'quadruple witching day' when volumes always increase as options and futures contracts expire and are re-negotiated.
Our trend model turned positive for all the major indexes this week. This is consistent with the more bullish outlook among investors. The American Association of Individual Investors (AAII) reports that bullish sentiment is at its highest level since August, 2009. (If you are a contrarian, this may not be good news!) They offer two reasons:
- "The first is the market’s recent rebound. The rise in stock prices is giving some investors hope that a short-term bottom in the market has been formed. The second is the reduction in chatter about potential deflation and a double-dip recession. Though the economic data has not been great, it has been good enough to give some assurance that recovery is continuing."
Real Time Volume Filters
A new addition to the cup-with-handle watchlist filter options allows you to restrict email alerts to only those CwH breakouts that meet a specific volume level.
This goes into effect on Monday, September 20, and is available to Trial and Platinum subscribers.
This new option allows you to receive alerts at the higher volume levels we have identified as necessary for the most successful breakouts.
Using Real Time Volume Filters
Platinum subscribers can set parameters that control when and on what basis they receive email alerts. These alerts are controlled from the "Filter Settings" tab on each watchlist.
The cup-with-handle watchlist now has an additional feature that allows you to set a real time volume threshold. The threshold can be higher or lower than the default volume threshold which is 150% of the 50 day moving average volume, and you can choose to receive alerts based on an actual volume threshold or a projected volume threshold.
A projected volume threshold is based on a straight line extrapolation of the volume at a specific time until the end of the session. For example, a session lasts 6.5 hours, so let the volume after 30 minutes by 100k shares, then the projected volume to the end of the session will be
The Backtest, which can be used to test which filter values have worked in the past, does not take into account these new volume filters.
Also, although our price data is in real time, our volume data is delayed by 15-20 minutes. For that reason, you may want to set the real time volume alert level
Platinum subscribers can set parameters that control when and on what basis they receive email alerts. These alerts are controlled from the "Filter Settings" tab on each watchlist.
The cup-with-handle watchlist now has an additional feature that allows you to set a real time volume threshold. The threshold can be higher or lower than the default volume threshold which is 150% of the 50 day moving average volume, and you can choose to receive alerts based on an actual volume threshold or a projected volume threshold.
A projected volume threshold is based on a straight line extrapolation of the volume at a specific time until the end of the session. For example, a session lasts 6.5 hours, so let the volume after 30 minutes by 100k shares, then the projected volume to the end of the session will be
100k / 0.5 * 6.5 => 1300k shares
If the projected volume threshold were
set at 1300k shares, then in this case an alert would be issued 30
minutes into the session.
If an actual volume threshold were set at 1300k shares, then an alert would not be issued until the actual daily volume level was reached, which would be some time later.
The projected and actual volume filters are mutually exclusive - you can set one or the other. If zero, then the volume filter is ignored.
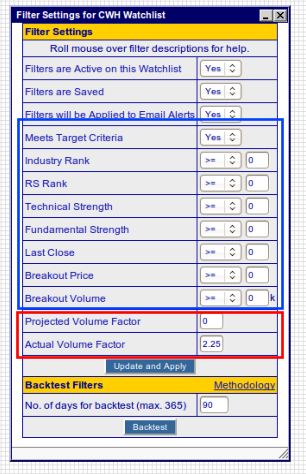
This example shows how an actual volume alert filter would be set combined with an MTC (Meets Target Criteria) filter.
If an actual volume threshold were set at 1300k shares, then an alert would not be issued until the actual daily volume level was reached, which would be some time later.
The projected and actual volume filters are mutually exclusive - you can set one or the other. If zero, then the volume filter is ignored.
This example shows how an actual volume alert filter would be set combined with an MTC (Meets Target Criteria) filter.
The filters outlined in blue represent
characteristics of the stock that are known before breakout and the two
filters outlined in red are the volume filters that are applied in real
time.
In this example, an alert would be sent when the actual volume reached 2.25 times the 50 day average volume.
In this example, an alert would be sent when the actual volume reached 2.25 times the 50 day average volume.
The Backtest, which can be used to test which filter values have worked in the past, does not take into account these new volume filters.
Also, although our price data is in real time, our volume data is delayed by 15-20 minutes. For that reason, you may want to set the real time volume alert level
| Index | Value | Change Week | Change YTD | Trend | ||||||||||||||||||||||||||||||||||||
|---|---|---|---|---|---|---|---|---|---|---|---|---|---|---|---|---|---|---|---|---|---|---|---|---|---|---|---|---|---|---|---|---|---|---|---|---|---|---|---|---|
| Dow | 10607.8 | 1.39% | 1.72% | Up | ||||||||||||||||||||||||||||||||||||
| NASDAQ | 2315.61 | 3.26% | 2.05% | Up | ||||||||||||||||||||||||||||||||||||
| S&P 500 | 1125.59 | 1.45% | 0.94% | Up | ||||||||||||||||||||||||||||||||||||
| Russell 2000 | 651.44 | 2.35% | 2.74% | Up | ||||||||||||||||||||||||||||||||||||
| Wilshire 5000 | 11740.4 | 1.63% | 2.11% | Up | ||||||||||||||||||||||||||||||||||||
1The Market Signal is derived from our proprietary
market model. The market model is described on the site. 2The site also shows industry rankings based on fundamentals, combined technical and fundamentals, and on price alone. The site also shows daily industry movements. |
||||||||||||||||||||||||||||||||||||||||
# of Breakouts |
Period Average1 |
Max. Gain During Period2 |
Gain at Period Close3 |
|
|---|---|---|---|---|
| This Week | 41 | 15.77 | 3.65% | 1.86% |
| Last Week | 10 | 13.92 | 4.69% | 2.12% |
| 13 Weeks | 219 | 16.15 | 11.83% |
6.53% |
2This represents the return if each stock were bought at its breakout price and sold at its intraday high.
3This represents the return if each stock were bought at its breakout price and sold at the most recent close.
Category |
Symbol |
Company Name |
Expected Gain1 |
|---|---|---|---|
| Best Overall | CCIX | Coleman Cable, Inc. | 105 |
| Top Technical | MFE | McAfee, Inc. | 28 |
| Top Fundamental | HMSY | HMS Holdings Corp. | 36 |
| Top Tech. & Fund. | HMSY | HMS Holdings Corp. | 36 |
Category |
Symbol |
Company Name |
Expected Gain1 |
|---|---|---|---|
| Best Overall | PIR | Pier 1 Imports Inc. | 100 |
| Top Technical | TPCG | 63 | |
| Top Fundamental | NEM | Newmont Mining Corp. | 37 |
| Top Tech. & Fund. | GIII | G-III Apparel Group, Ltd. | 51 |
If you received this newsletter from a friend and you would like to receive it regularly please go to the BreakoutWatch.com site and enter as a Guest. You will then be able to register to receive the newsletter.
Copyright © 2010 NBIcharts, LLC dba BreakoutWatch.com.
All rights reserved.
"
BreakoutWatch," the BreakoutWatch.com "eye" logo, and the
slogan "tomorrow's breakouts today" are service marks of NBIcharts
LLC. All other marks are the property of their respective owners, and are
used for descriptive purposes only.
BreakoutWatch is not affiliated with Investor's Business Daily or with Mr. William O'Neil.
Our site, research and analysis is supported entirely by subscription and is free from advertising.