| Market Summary | Weekly Breakout Report | Top Breakout Choices | Top 2nd Chances | New Features | Tip of the Week |
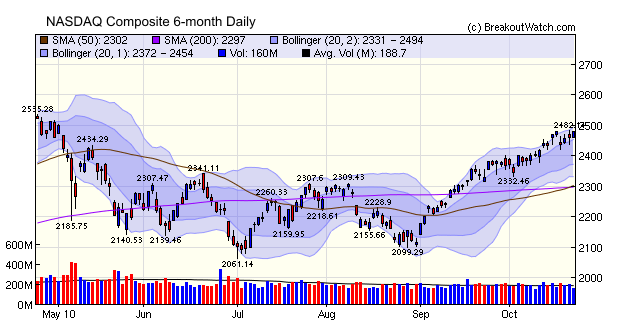
The major indexes are looking a little tired. The NASDAQ Composite chart is representative of the DJI and S&P 500. It shows the indexes are consolidating ahead of the election in 10 days and the FOMC meeting which coincides with the election. The trend is still up, but at a slower pace as the modest gains for the week (see the data below) show.
You will have read that the markets have most probably factored in the Quantitative Easing (QE) expected from the FOMC meeting and the consolidation evident in the NASDAQ chart would seem to confirm that hypothesis.
While the indexes may consolidate further in the next 10 days, there will still be individual stocks that make spectacular breakouts. For example, yesterday VIcor (VICR), which was a "MTC" choice gained 14%. Other MTC stocks that made strong gains recently were LDK (24.3%), NBIX (31.7%). Overall, this weeks breakouts rose 3% compared to the major indexes that were little changed.
We have consolidated the alert preferences setting (previously split between Account Management and Alert Preferences) into a single Alert Preferences page under Take Action - Alerts!. A screen shot is shown below.
Your existing settings should not be affected by this re-organization.
Understanding Email Alerts
Where, how and under what conditions alerts are managed and sent may be confusing so we have developed this short guide.
We deliver email alerts when a stock reaches its breakout (or breakdown) price. Email alerts are available to Trial, Gold and Platinum subscribers and there are several methods of selecting which alerts to receive and when. The purpose of this article is to explain how to manage and interpret our email alerts.
Email Alert Options and Management
- Email alerts are available to Trial, Gold and Platinum subscribers
- Alerts are turned on or off through the Take Action - Alerts! > Alert Preferences menu choice
- Alerts on "Long Position" watchlists are automatically
enabled but can be disabled
- Alerts on "Short Position" watchlists are not automatically enabled and must be specifically requested
- Trial and Platinum Subscribers are able to control what alerts they will receive
- The alerts to be received are also controlled from the Take Action - Alerts! > Alert Preferences menu choice
- You can choose to select
- only those alerts that meet your watchlists filters (set
for each watchlist)
- only alerts for symbols that are in your Personal
Watchlists (PWLs)
- alerts that satisfy your filters and/or are on your PWLs
- When you view the site Alert Monitor, the monitor will show symbols that correspond to your alert preferences. You can also choose to see the status of all alerts in the Alert Monitor
- Email alerts matching your alert pereferences are sent as
soon a
stock rises to its breakout price or falls to its breakdown price.
- Normally, daily volume is not a factor
- However, if you set a minimum volume on your
cup-with-handle
filter, then you will receive an email from the CwH list only when the
daily volume reaches that level
- The volumes in email alerts are delayed by 15 minutes for
the NASDAQ and 20 minutes for the NYSE and Am Ex exchanges.
- The projected volume shown in the alert is a "straight line" projection of the delayed volume until the end of the session. Frequently, volume is heaviest in the first 30 minutes of trading, so early projected volume figures are not likely to be accurate
- We have undertaken considerable research into what volume
levels
are necessary for a successful breakout. We found that while a
successful breakout can occur for almost any volume level, breakouts
with a volume level of 2.25 times the 50 day average volume are more
likely to give a return of at least 25% following breakout. We
therefore suggest that you only enter a long position when the daily
volume has already reached the 2.25 times ADV threshold.
Factors Affecting Performance After Breakout
We have used our extensive history of breakouts from a Cup-with-Handle pattern to evaluate the factors that will most likely lead to breakouts that gain at least 25% in the six months after breakout, even allowing for those that get stopped-out with an 8% stop loss factor.
Part 1: The Influence of Breakout Day Volume
Part 2: The Influence of RS Rank
Part 3: Further Analysis of RS Rank
Part 4: The Influence of Fundamentals, Rank in Industry and Industry Rank
Part 5: The Influence of Specific Fundamental Factors and Conclusion
| Index | Value | Change Week | Change YTD | Trend | ||||||||||||||||||||||||||||||||||||
|---|---|---|---|---|---|---|---|---|---|---|---|---|---|---|---|---|---|---|---|---|---|---|---|---|---|---|---|---|---|---|---|---|---|---|---|---|---|---|---|---|
| Dow | 11132.6 | 0.63% | 6.76% | Up | ||||||||||||||||||||||||||||||||||||
| NASDAQ | 2479.39 | 0.43% | 9.27% | Up | ||||||||||||||||||||||||||||||||||||
| S&P 500 | 1183.08 | 0.59% | 6.1% | Up | ||||||||||||||||||||||||||||||||||||
| Russell 2000 | 703.43 | 0.04% | 10.94% | Up | ||||||||||||||||||||||||||||||||||||
| Wilshire 5000 | 12391.5 | 0.52% | 7.78% | Up | ||||||||||||||||||||||||||||||||||||
1The Market Signal is derived
from our proprietary market model. The market model is described on the
site.
2The site also shows industry rankings based on fundamentals, combined technical and fundamentals, and on price alone. The site also shows daily industry movements. |
||||||||||||||||||||||||||||||||||||||||
|
# of Breakouts
|
Period Average1
|
Max. Gain During Period2
|
Gain at Period Close3
|
|
|---|---|---|---|---|
| This Week | 27 | 26.38 | 5.3% | 2.98% |
| Last Week | 24 | 25.92 | 7.54% | 2.84% |
| 13 Weeks | 356 | 27.77 | 15.71% |
8.77% |
2This represents the return if each stock were bought at its breakout price and sold at its intraday high.
3This represents the return if each stock were bought at its breakout price and sold at the most recent close.
|
Category
|
Symbol
|
Company Name
|
Expected Gain1
|
|---|---|---|---|
| Best Overall | QLTY | Quality Distribution Inc. | 115 |
| Top Technical | LFL | LAN Airlines S.A. | 43 |
| Top Fundamental | GSIT | GSI Technology Inc. | 99 |
| Top Tech. & Fund. | LFL | LAN Airlines S.A. | 43 |
|
Category
|
Symbol
|
Company Name
|
Expected Gain1
|
|---|---|---|---|
| Best Overall | REXI | Resource America Inc. | 108 |
| Top Technical | REXI | Resource America Inc. | 108 |
| Top Fundamental | LPSN | LivePerson Inc. | 93 |
| Top Tech. & Fund. | LPSN | LivePerson Inc. | 93 |
If you received this newsletter from a friend and you would like to receive it regularly please go to the BreakoutWatch.com site and enter as a Guest. You will then be able to register to receive the newsletter.
Copyright © 2010 NBIcharts, LLC dba BreakoutWatch.com.
All rights reserved.
" BreakoutWatch," the BreakoutWatch.com "eye" logo, and the slogan
"tomorrow's breakouts today" are service marks of NBIcharts LLC. All
other marks are the property of their respective owners, and are used
for descriptive purposes only.
BreakoutWatch is not affiliated with Investor's Business Daily
or with Mr. William O'Neil.
Our site, research and analysis is supported entirely by subscription
and is free from advertising.