| Market Summary | Weekly Breakout Report | Top Breakout Choices | Top 2nd Chances | New Features | Tip of the Week |
The major indexes gave up all of their gains for the week on Friday as instability in Egypt mounted and the price of oil futures rose. Well over a million barrels of oil move daily through the Suez canal so the potential is very real for any disruption to further damage western economies. The likelihood of a closing of the canal has to be considered remote but as long as the situation is unstable market volatility will remain high.
These geopolitical concerns coincided with a disappointing GDP report which fell below expectations, a large drop in profits at Ford Motor, falling Windows sales at Microsoft and a warning from Amazon that earnings may miss analyst's projections.
Confidence had been building throughout the week after last week's mild correction. Our equivolume chart, which succinctly combines price and volume, dramatically illustrates how fear overwhelmed mounting optimism. That optimism may return once the situation is resolved but that could take a while. Demonstrations in Egypt after the apparent successes in Tunisia remind me of 1848 when revolutions swept across Europe. We could see a spreading backlash against repressive arab regimes that will roil markets for some time.
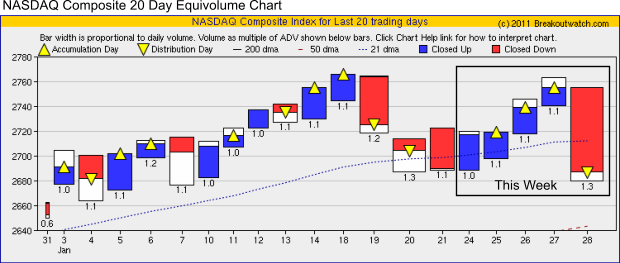
The failure of the index to test the January 18 high shows technical weakness and if uncertainty continues we could see a test of the 50 day moving average.
We noticed that the Site Search was broken so we have added a custom search feature from Google.
This is available either from the home page or from the sidebar after logging in.
This is available either from the home page or from the sidebar after logging in.
Although our market trend signals still point up, I think its wise to sit things out until the smoke clears.
| Index | Value | Change Week | Change YTD | Trend | ||||||||||||||||||||||||||||||||||||
|---|---|---|---|---|---|---|---|---|---|---|---|---|---|---|---|---|---|---|---|---|---|---|---|---|---|---|---|---|---|---|---|---|---|---|---|---|---|---|---|---|
| Dow | 11823.7 | -0.41% | 2.13% | Up | ||||||||||||||||||||||||||||||||||||
| NASDAQ | 2686.89 | -0.1% | 1.28% | Up | ||||||||||||||||||||||||||||||||||||
| S&P 500 | 1276.34 | -0.55% | 1.49% | Up | ||||||||||||||||||||||||||||||||||||
| Russell 2000 | 775.4 | 0.29% | -1.05% | Up | ||||||||||||||||||||||||||||||||||||
| Wilshire 5000 | 13450.8 | -0.36% | 1.21% | Up | ||||||||||||||||||||||||||||||||||||
1The Market Signal is derived from our proprietary
market model. The market model is described on the site. 2The site also shows industry rankings based on fundamentals, combined technical and fundamentals, and on price alone. The site also shows daily industry movements. |
||||||||||||||||||||||||||||||||||||||||
# of Breakouts |
Period Average1 |
Max. Gain During Period2 |
Gain at Period Close3 |
|
|---|---|---|---|---|
| This Week | 12 | 16.69 | 4.88% | 0.14% |
| Last Week | 11 | 18.15 | 2.51% | -2.65% |
| 13 Weeks | 265 | 19.08 | 13.93% |
2.49% |
2This represents the return if each stock were bought at its breakout price and sold at its intraday high.
3This represents the return if each stock were bought at its breakout price and sold at the most recent close.
Category |
Symbol |
Company Name |
Expected Gain1 |
|---|---|---|---|
| Best Overall | OSUR | OraSure Technologies, Inc. | 102 |
| Top Technical | KRO | Kronos Worldwide, Inc. | 47 |
| Top Fundamental | PWER | Power-One, Inc. | 77 |
| Top Tech. & Fund. | ATHR | Atheros Communications, Inc. | 45 |
Category |
Symbol |
Company Name |
Expected Gain1 |
|---|---|---|---|
| Best Overall | PLA | Playboy Enterprises, Inc. | 79 |
| Top Technical | PLA | Playboy Enterprises, Inc. | 79 |
| Top Fundamental | FTNT | Fortinet, Inc. | 51 |
| Top Tech. & Fund. | FTNT | Fortinet, Inc. | 51 |
If you received this newsletter from a friend and you would like to receive it regularly please go to the BreakoutWatch.com site and enter as a Guest. You will then be able to register to receive the newsletter.
Copyright © 2011 NBIcharts, LLC dba BreakoutWatch.com.
All rights reserved.
"
BreakoutWatch," the BreakoutWatch.com "eye" logo, and the
slogan "tomorrow's breakouts today" are service marks of NBIcharts
LLC. All other marks are the property of their respective owners, and are
used for descriptive purposes only.
BreakoutWatch is not affiliated with Investor's Business Daily or with Mr. William O'Neil.
Our site, research and analysis is supported entirely by subscription and is free from advertising.