| Market Summary | Weekly Breakout Report | Top Breakout Choices | Top 2nd Chances | New Features | Tip of the Week |
The markets continued to move higher on above average volume. The volatile Russell 2000 outpaced the other major indexes we follow but large cap stocks represented by the Dow Jones 30 is showing the best gain for the year so far driven by higher energy and commodity prices. Market participants seem to think that companies that are global competitors are best positioned to take advantage of the world wide recovery while the economy at home continues to struggle, and will likely do so for several years as home prices continue to fall and unemployment remains high.
While the domestic economy is struggling, not so the markets as cheap money continues to fuel what is increasingly looking like another asset bubble - this time in stocks. Chartoftheday.com provides the following chart showing just how much the major indexes have retraced since the bottom.
Until the Fed's Quantitave Easing
policy is relaxed, it would seem that the markets will continue to move
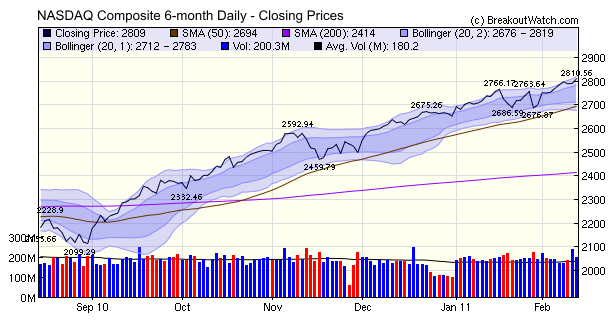
higher. Our "Bollinger Bands" charts show daily prices with envelopes
at one and two standard deviations away from the closing price mean.
The chart of the closing price of the NASDAQ Composite shows that over
the last six months the index has mostly trended higher in a range
between the +1 and +2 standard deviation (SD) regions. Only rarely has
it consolidated to the -1 SD band and never to the -2. This implies
that the downside risk is lower than the probability of upside gains,
at least for now. Since the beginning of February the index has traded
above the +1 SD and you can see from the chart that this trend has
often continued for several weeks before a short consolidation occurs.
The number of confirmed breakouts rose to 24 this week, well above the 13 week average of 14. The highest fliers were Photronics, inc (PLAB) with again of 22.5% and Federal Agricultural Mortgage Corporation (Farmer Mac) (AGM) with a 13.4% gain.
The number of confirmed breakouts rose to 24 this week, well above the 13 week average of 14. The highest fliers were Photronics, inc (PLAB) with again of 22.5% and Federal Agricultural Mortgage Corporation (Farmer Mac) (AGM) with a 13.4% gain.
No new features this week.
This feature will return next week.
| Index | Value | Change Week | Change YTD | Trend | ||||||||||||||||||||||||||||||||||||
|---|---|---|---|---|---|---|---|---|---|---|---|---|---|---|---|---|---|---|---|---|---|---|---|---|---|---|---|---|---|---|---|---|---|---|---|---|---|---|---|---|
| Dow | 12273.3 | 1.5% | 6.01% | Up | ||||||||||||||||||||||||||||||||||||
| NASDAQ | 2809.44 | 1.45% | 5.9% | Up | ||||||||||||||||||||||||||||||||||||
| S&P 500 | 1329.15 | 1.39% | 5.69% | Up | ||||||||||||||||||||||||||||||||||||
| Russell 2000 | 822.11 | 2.75% | 4.91% | Up | ||||||||||||||||||||||||||||||||||||
| Wilshire 5000 | 14044.5 | 1.64% | 5.68% | Up | ||||||||||||||||||||||||||||||||||||
1The Market Signal is derived from our proprietary
market model. The market model is described on the site. 2The site also shows industry rankings based on fundamentals, combined technical and fundamentals, and on price alone. The site also shows daily industry movements. |
||||||||||||||||||||||||||||||||||||||||
# of Breakouts |
Period Average1 |
Max. Gain During Period2 |
Gain at Period Close3 |
|
|---|---|---|---|---|
| This Week | 24 | 14.54 | 4.55% | 3.04% |
| Last Week | 18 | 13.85 | 9.26% | 5.55% |
| 13 Weeks | 224 | 15.77 | 13.16% |
6.1% |
2This represents the return if each stock were bought at its breakout price and sold at its intraday high.
3This represents the return if each stock were bought at its breakout price and sold at the most recent close.
Category |
Symbol |
Company Name |
Expected Gain1 |
|---|---|---|---|
| Best Overall | HIL | Hill International Inc. | 105 |
| Top Technical | BEE | Strategic Hotels & Resorts Inc. | 101 |
| Top Fundamental | MELI | MercadoLibre, Inc. | 41 |
| Top Tech. & Fund. | MELI | MercadoLibre, Inc. | 41 |
Category |
Symbol |
Company Name |
Expected Gain1 |
|---|---|---|---|
| Best Overall | LZR | Emergent Group Inc | 85 |
| Top Technical | TNAV | TeleNav, Inc. | 84 |
| Top Fundamental | TNAV | TeleNav, Inc. | 84 |
| Top Tech. & Fund. | TNAV | TeleNav, Inc. | 84 |
If you received this newsletter from a friend and you would like to receive it regularly please go to the BreakoutWatch.com site and enter as a Guest. You will then be able to register to receive the newsletter.
Copyright © 2011 NBIcharts, LLC dba BreakoutWatch.com.
All rights reserved.
"
BreakoutWatch," the BreakoutWatch.com "eye" logo, and the
slogan "tomorrow's breakouts today" are service marks of NBIcharts
LLC. All other marks are the property of their respective owners, and are
used for descriptive purposes only.
BreakoutWatch is not affiliated with Investor's Business Daily or with Mr. William O'Neil.
Our site, research and analysis is supported entirely by subscription and is free from advertising.