| Market Summary | Weekly Breakout Report | Top Breakout Choices | Top 2nd Chances | New Features | Tip of the Week |
Our market trend indicator for the NASDAQ Composite turned down on Thursday (06/02). The NASDAQ trend joins the Russell 2000 which turned down back on May 23. Economic data released this week show that manufacturing has slowed, the economy is not adding enough jobs to stop unemployment from rising, retailers are hurting, consumer confidence is slipping and home prices are continuing to fall.
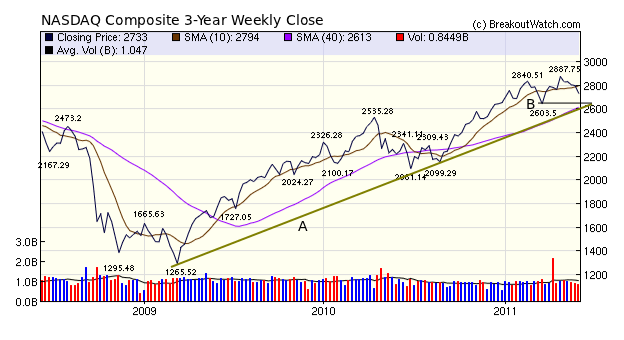
The economic slowdown means profits are likely to fall and with them, stock prices. Federal Reserve policies have supported the recovery in stocks but with quantitative easing ending, there is a good case to be made for bearish sentiment to increase. The NASDAQ Composite 3-year weekly chart shows that a decline to the support level at about 2600 (line B) is likely which would also coincide with the long-term support trend line in place since April, 2009 (line A). A fall to 2600 would represent a further 4.8% decline from Friday's close.
Our down data confirms the bearish trend: we saw forty breakdowns in this short week compared to just eleven breakouts. Making profits on breakouts is difficult when the market is moving down and of the eleven, seven were under water by Friday's close.
The majority of breakdowns (25) came from a head and shoulders top formation. We have previously found that pattern to be a very reliable indicator of stocks that are about to breakdown. See this weeks Top Tip.
No new features this week.
Head and Shoulders Chart Pattern Analysis
When we first introduced our Head and Shoulders Top (HST) pattern as a means of detecting short sale candidates our backtesting showed that when we detected this pattern a subsequent breakdown occurred in over 96% of cases.You can read our backtest methodology and results here.
We concluded that
- If you hold a long position in a stock that has completed the right shoulder of an H&S pattern, then you should sell because 96% of these stocks will break down.
- Because of the high probability that a breakdown is about to occur, you may wish to open a short position immediately an H&S is identified before waiting for the breakdown. The position can then be added to when the breakdown occurs.
- Immediately after the breakdown, set a stop loss at the breakdown price to protect yourself against the 17.6% of breakdowns that recover the next day. Otherwise, a reasonable target profit for the trade is 70% of the target price.
- Short selling is risky because your potential loss is unlimited. When going long, the maximum amount you can lose is your initial investment, when shorting there is no limit to how high the stock can go from your entry level, so cover quickly when the stock moves against you.
- Review the H&S Top watchlist prior to the market open to select stocks you would consider shorting if an alert is issued.
- Set a target cover price (see methodology tab on the HST watchlist) before you go short, using either a fixed percentage or an expected support level, and take profits at that level.
- If you go short on an alert and the stock recovers above the support level by the close, consider covering your position immediately.
- If you go short on an alert and the stock closes below the support price but volume doesn't meet the 1.5 times adv requirement, don't cover but wait for the action on the following day.
- Cover when a support level is tested and found to hold.
- Don't bet against the market.
| Index | Value | Change Week | Change YTD | Trend | ||||||||||||||||||||||||||||||||||||
|---|---|---|---|---|---|---|---|---|---|---|---|---|---|---|---|---|---|---|---|---|---|---|---|---|---|---|---|---|---|---|---|---|---|---|---|---|---|---|---|---|
| Dow | 12151.3 | -2.33% | 4.96% | Up | ||||||||||||||||||||||||||||||||||||
| NASDAQ | 2732.78 | -2.29% | 3.01% | Down | ||||||||||||||||||||||||||||||||||||
| S&P 500 | 1300.16 | -2.32% | 3.38% | Up | ||||||||||||||||||||||||||||||||||||
| Russell 2000 | 808.13 | -3.36% | 3.12% | Down | ||||||||||||||||||||||||||||||||||||
| Wilshire 5000 | 13742.8 | -2.46% | 3.41% | Up | ||||||||||||||||||||||||||||||||||||
1The Market Signal is derived from our proprietary
market model. The market model is described on the site. 2The site also shows industry rankings based on fundamentals, combined technical and fundamentals, and on price alone. The site also shows daily industry movements. |
||||||||||||||||||||||||||||||||||||||||
# of Breakouts |
Period Average1 |
Max. Gain During Period2 |
Gain at Period Close3 |
|
|---|---|---|---|---|
| This Week | 12 | 11.92 | 5.39% | -0.27% |
| Last Week | 12 | 13.08 | 5.52% | -2.14% |
| 13 Weeks | 195 | 14.08 | 10.66% |
-0.8% |
2This represents the return if each stock were bought at its breakout price and sold at its intraday high.
3This represents the return if each stock were bought at its breakout price and sold at the most recent close.
Category |
Symbol |
Company Name |
Expected Gain1 |
|---|---|---|---|
| Best Overall | CLFD | Clearfield, Inc. | 124 |
| Top Technical | BRNC | Bronco Drilling Company, Inc. | 67 |
| Top Fundamental | CPSI | Computer Programs & Systems, Inc. | 37 |
| Top Tech. & Fund. | CPSI | Computer Programs & Systems, Inc. | 37 |
Category |
Symbol |
Company Name |
Expected Gain1 |
|---|---|---|---|
| Best Overall | ZAGG | Zagg Inc | 87 |
| Top Technical | ZAGG | Zagg Inc | 87 |
| Top Fundamental | ZAGG | Zagg Inc | 87 |
| Top Tech. & Fund. | ZAGG | Zagg Inc | 87 |
If you received this newsletter from a friend and you would like to receive it regularly please go to the BreakoutWatch.com site and enter as a Guest. You will then be able to register to receive the newsletter.
Copyright © 2011 NBIcharts, LLC dba BreakoutWatch.com.
All rights reserved.
"
BreakoutWatch," the BreakoutWatch.com "eye" logo, and the
slogan "tomorrow's breakouts today" are service marks of NBIcharts
LLC. All other marks are the property of their respective owners, and are
used for descriptive purposes only.
BreakoutWatch is not affiliated with Investor's Business Daily or with Mr. William O'Neil.
Our site, research and analysis is supported entirely by subscription and is free from advertising.