| Market Summary | Weekly Breakout Report | Top Breakout Choices | Top 2nd Chances | New Features | Tip of the Week |
As usual, we focus on the NASDAQ Composite index as it is from NASDAQ listed stocks that we see the most breakouts and breakdowns.
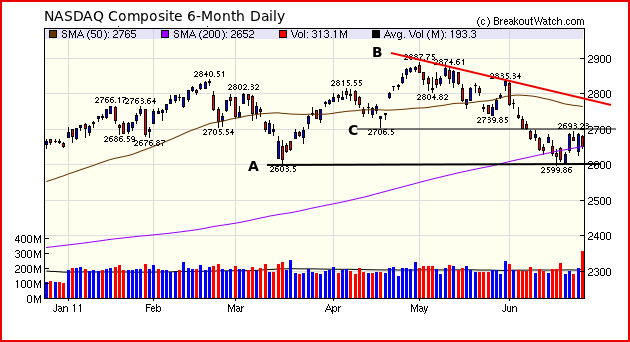
The index is in a bearish descending triangle pattern bounded by lines A and B. The recent recovery, which was never very soundly based due to weak volume, is threatened following Friday's 1.3% decline on very heavy volume. The index did find support on Friday at the 200 dma level as it rose in the last few minutes of trading to close at that level. Should the index continue to gain ground early next week, it will meet some resistance in the vicinity of 2700 (line C).
The markets will continue to be erratic and prone to sudden bouts of panic until the debt ceiling is raised at home and the European debt situation is resolved. Political brinkmanship in Washington will make the markets ever more nervous as the August deadline approaches and the possibility of a US default becomes more possible, as improbable as that seems.
The European crisis will not be resolved until European banks are forced to accept a haircut on the sovereign debt obligations of at least Greece and possible Italy and Spain. With the Germans adamantly opposed to either lending Greece further money, so the banks can be made whole, or indemnifying their banks for their losses in the event of a Greek default, it seems probable that the impasse will continue.
For these reasons it seems likely that the present bearish trend in the US markets will continue.
The number of breakouts jumped to fourteen this week with an average gain of 3.5% - significantly beating the market averages.
We added an option to the Zack's Backtest page to allow comparison of gains to those of the major indexes.
This week we respond to two questions from subscribers.
Zacks Strategy Backtest
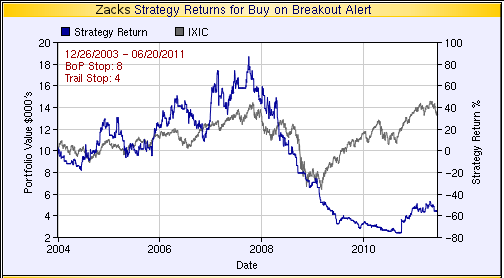
A subscriber noted that the performance given in the backtest when run from 2004 to the present was hardly a recommendation for the strategy. The results are shown in this chart from which you can see that performance was very good before the crash and then performed poorly after the March 2009 recovery until mid-2010. We were always puzzled about why it performed poorly even after the recovery had begun but never found a satisfactory explanation.
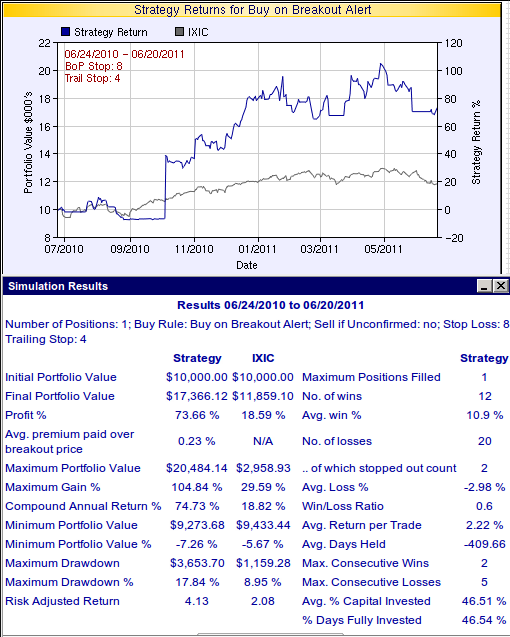
Over the last year, however, the strategy has performed exceptionally well as the next chart and table show. The strategy resulted in a 73% gain while the NASDAQ Composite gained only 18%.
Our Zacks selections are available on our Zacks Strong Buy watchlist. You will need to supply a Zack's login to access them, but a free, no obligation, 30 day trial is available by clicking the Zacks logo here:
Head and Shoulders Breakdown Success Rate
Another subscriber asked if our head and shoulders top (HST) pattern gave a 93% success rate as quoted by Bulkowski in his Encyclopedia of Chart Patterns (Wiley, 2000) and referred to in our strategy notes for this pattern.
We had never tested this so I performed an analysis of all the HST confirmed breakdowns (2606) since we introduced this pattern in July, 2006. I selected all the confirmed breakdowns and looked at whether or not they closed below their breakdown price in the next 20 trading sessions. I then tabulated how many remained below their breakdown price for each day and the average profit a short sale would have made for those days. You can see from the chart below that on the first day after breakout, 74% remained below their breakdown price, so to avoid a loss you would have needed to cover 26% of the breakdowns on the first day. At the end of the 20 sessions, just 43 % were still below their breakdown price, or 57% had pulled back to at least their BD price. Compare this with Bulkowski's finding that 45% pulled back.
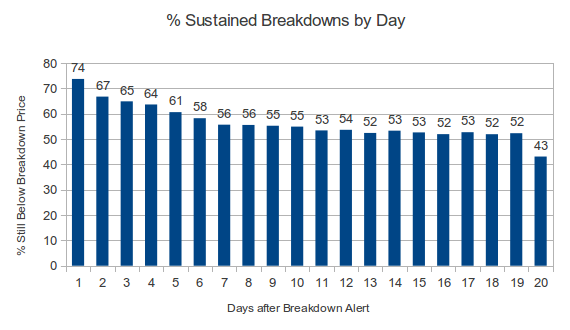
I also looked at the % average profit that was made each day based on the close that day for those that were below their breakdown price.
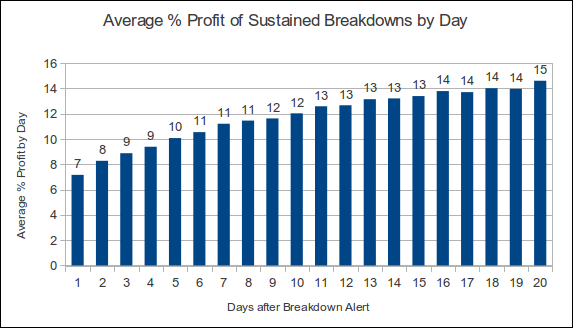
To interpret the meaning of this chart, lets assume that you were lucky enough to cover the 26% of stocks that rose back to or above their breakdown price at the breakdown price giving you zero profit or loss. Then if you closed all 73% of positions below their BD price at the close on day one, you would make an average of 7%. If you closed all 67% of positions below their BD price on day 2 you would make 8%, and so on.
This tells us that the expected profit if we were able to cover each position at the best possible price for a maximum hold period of 20 sessions is 11.5%. This again is quite different from Bulkowski's finding of an average decline of 23%.
These findings are clearly significantly different from Bulkowski's but consider that our sample of 2606 is considerably bigger than his sample of 461 and our time period 7/2006 - 6/2011 is very different from his: mid 1991 to mid 1996. Also our algorithms, each conceived independently, for recognizing the HST pattern would also necessarily be very different.
My conclusion is that the HST pattern can be highly profitable as it is successful, giving at least a 7% profit, in 74% of trades.
| Index | Value | Change Week | Change YTD | Trend | ||||||||||||||||||||||||||||||||||||
|---|---|---|---|---|---|---|---|---|---|---|---|---|---|---|---|---|---|---|---|---|---|---|---|---|---|---|---|---|---|---|---|---|---|---|---|---|---|---|---|---|
| Dow | 11934.6 | -0.58% | 3.08% | Up | ||||||||||||||||||||||||||||||||||||
| NASDAQ | 2652.89 | 1.39% | 0% | Down | ||||||||||||||||||||||||||||||||||||
| S&P 500 | 1268.45 | -0.24% | 0.86% | Up | ||||||||||||||||||||||||||||||||||||
| Russell 2000 | 797.79 | 2.05% | 1.8% | Down | ||||||||||||||||||||||||||||||||||||
| Wilshire 5000 | 13424.9 | 0.21% | 1.02% | Up | ||||||||||||||||||||||||||||||||||||
1The Market Signal is derived from our proprietary
market model. The market model is described on the site. 2The site also shows industry rankings based on fundamentals, combined technical and fundamentals, and on price alone. The site also shows daily industry movements. |
||||||||||||||||||||||||||||||||||||||||
# of Breakouts |
Period Average1 |
Max. Gain During Period2 |
Gain at Period Close3 |
|
|---|---|---|---|---|
| This Week | 14 | 11.38 | 5.73% | 3.46% |
| Last Week | 3 | 11.31 | 6.43% | 0.3% |
| 13 Weeks | 184 | 12.15 | 10.12% |
-1.07% |
2This represents the return if each stock were bought at its breakout price and sold at its intraday high.
3This represents the return if each stock were bought at its breakout price and sold at the most recent close.
Category |
Symbol |
Company Name |
Expected Gain1 |
|---|---|---|---|
| Best Overall | GNMK | GenMark Diagnostics, Inc | 114 |
| Top Technical | NSTC | Ness Technologies, Inc. | 83 |
| Top Fundamental | VRTS | Virtus Investment Partners, Inc. | 32 |
| Top Tech. & Fund. | VRTS | Virtus Investment Partners, Inc. | 32 |
Category |
Symbol |
Company Name |
Expected Gain1 |
|---|---|---|---|
| Best Overall | VVTV | ValueVision Media, Inc. | 95 |
| Top Technical | BIIB | Biogen Idec Inc. | 33 |
| Top Fundamental | CPHD | Cepheid | 38 |
| Top Tech. & Fund. | CPHD | Cepheid | 38 |
If you received this newsletter from a friend and you would like to receive it regularly please go to the BreakoutWatch.com site and enter as a Guest. You will then be able to register to receive the newsletter.
Copyright © 2011 NBIcharts, LLC dba BreakoutWatch.com.
All rights reserved.
"
BreakoutWatch," the BreakoutWatch.com "eye" logo, and the
slogan "tomorrow's breakouts today" are service marks of NBIcharts
LLC. All other marks are the property of their respective owners, and are
used for descriptive purposes only.
BreakoutWatch is not affiliated with Investor's Business Daily or with Mr. William O'Neil.
Our site, research and analysis is supported entirely by subscription and is free from advertising.