| Market Summary | Weekly Breakout Report | Top Breakout Choices | Top 2nd Chances | New Features | Tip of the Week |
All the major indexes suffered losses as concerns over the debt ceiling impasse grew and our trend indicator for the Russell 2000, the most volatile of the indexes we follow, turned negative.
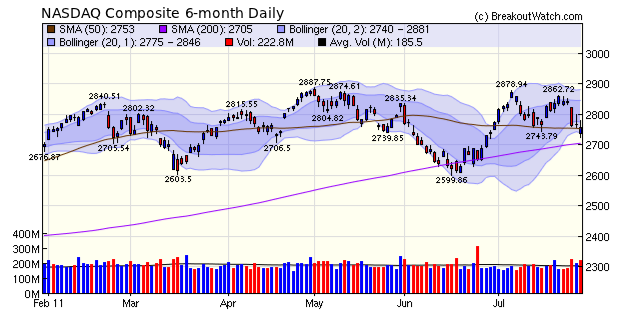
Friday brought gloomy economic news as GDP grew at just 1.3% in the second quarter and earlier quarters were revised downward showing that the recession was deeper than we knew. Despite this news and and continued wrangling over the debt ceiling issue, the NASDAQ Composite closed down only 0.4% on Friday after being 1.2% lower shortly after the open. The larger cap DJI and S&P 500 indexes lost 0.8 and 0.7% respectively. That the markets are not more concerned over a possible downgrade by the ratings agencies seems to indicate that they are assuming that a compromise will eventually be reached that will allow the debt ceiling to rise, and even if it doesn't, that US Treasuries will remain the reserve currency of the world.
With spending cuts baked into whatever plan is finally adopted, GDP will fall further in the short term as government expenditure is cut and unemployment will remain high. Consumer demand, the engine of the economy, will therefore remain depressed so we may be entering another bear market. The NASDAQ closed below its 50 day moving average and the 50 dma line is ominously trending downward providing a technical indicator supporting the bear market hypothesis.
No new features this week.
Does the Meets Target Criteria (MTC) Indicator Yield Better Results?
It is over 18 months since we introduced our Meets Target Criteria (MTC) indicator so we decided to see if choosing stocks flagged with the MTC 'thumbs up' indicator outperformed other breakouts.
To do this we looked at the highest intraday high made by stocks with the MTC indicator versus those that were not flagged as MTC over periods from 10 days to 180 days after breakout. If a stock fell by more than 8% intraday from its breakout price after breakout then we used the highest intraday high before that date in our analysis.
The analysis showed that for each period examined the MTC stocks reached higher intraday highs than the non-MTC stocks.
For example, in the first 10 days after breakout, MTC stocks gained 1.46% more than non-MTC stocks. That's an improvement of over 20%. As you can see, the degree of improvement fell off as the time given for the stocks to reach their intraday high lengthened, but the MTC stocks always outperformed the non-MTC stocks.
Our conclusion then is that when given a choice between taking a position in an MTC stock versus a non-MTC stock, then you should choose the MTC stock.
| Days After Breakout | MTC Avg. % Gain | Non-MTC Avg. % Gain | Difference | MTC Improvement |
| 10 | 8.53 | 7.07 | 1.46 | 20.65% |
| 20 | 12.53 | 11.01 | 1.52 | 13.81% |
| 30 | 17.25 | 14.28 | 2.97 | 20.80% |
| 40 | 20.66 | 17.3 | 3.36 | 19.42% |
| 50 | 23.93 | 19.96 | 3.97 | 19.89% |
| 60 | 26.09 | 22.21 | 3.88 | 17.47% |
| 70 | 28.81 | 24.4 | 4.41 | 18.07% |
| 80 | 30.56 | 26.35 | 4.21 | 15.98% |
| 90 | 31.98 | 28.23 | 3.75 | 13.28% |
| 100 | 33.9 | 30.04 | 3.86 | 12.85% |
| 110 | 35.23 | 31.37 | 3.86 | 12.30% |
| 120 | 36.11 | 32.47 | 3.64 | 11.21% |
| 130 | 37.25 | 33.86 | 3.39 | 10.01% |
| 140 | 38.88 | 35.55 | 3.33 | 9.37% |
| 150 | 40.15 | 36.72 | 3.43 | 9.34% |
| 160 | 41.6 | 38.11 | 3.49 | 9.16% |
| 170 | 42.47 | 39.57 | 2.9 | 7.33% |
| 180 | 43.09 | 40.52 | 2.57 | 6.34% |
| Index | Value | Change Week | Change YTD | Trend | ||||||||||||||||||||||||||||||||||||
|---|---|---|---|---|---|---|---|---|---|---|---|---|---|---|---|---|---|---|---|---|---|---|---|---|---|---|---|---|---|---|---|---|---|---|---|---|---|---|---|---|
| Dow | 12143.2 | -4.24% | 4.89% | Up | ||||||||||||||||||||||||||||||||||||
| NASDAQ | 2756.38 | -3.58% | 3.9% | Up | ||||||||||||||||||||||||||||||||||||
| S&P 500 | 1292.28 | -3.92% | 2.75% | Up | ||||||||||||||||||||||||||||||||||||
| Russell 2000 | 797.03 | -5.32% | 1.71% | Down | ||||||||||||||||||||||||||||||||||||
| Wilshire 5000 | 13643.1 | -4.12% | 2.66% | Up | ||||||||||||||||||||||||||||||||||||
1The Market Signal is derived from our proprietary
market model. The market model is described on the site. 2The site also shows industry rankings based on fundamentals, combined technical and fundamentals, and on price alone. The site also shows daily industry movements. |
||||||||||||||||||||||||||||||||||||||||
# of Breakouts |
Period Average1 |
Max. Gain During Period2 |
Gain at Period Close3 |
|
|---|---|---|---|---|
| This Week | 17 | 13 | 5.87% | 2.06% |
| Last Week | 29 | 12.85 | 6.31% | -2.63% |
| 13 Weeks | 221 | 14.08 | 9.31% |
-2.22% |
2This represents the return if each stock were bought at its breakout price and sold at its intraday high.
3This represents the return if each stock were bought at its breakout price and sold at the most recent close.
Category |
Symbol |
Company Name |
Expected Gain1 |
|---|---|---|---|
| Best Overall | KOG | Kodiak Oil & Gas Corp. | 106 |
| Top Technical | DBLE | Double Eagle Petroleum Co. | 71 |
| Top Fundamental | CHSI | Catalyst Health Solutions, Inc. | 40 |
| Top Tech. & Fund. | CHSI | Catalyst Health Solutions, Inc. | 40 |
Category |
Symbol |
Company Name |
Expected Gain1 |
|---|---|---|---|
| Best Overall | KOG | Kodiak Oil & Gas Corp. | 110 |
| Top Technical | DBP | PowerShares DB Precious Metals Fd (ETF) | 37 |
| Top Fundamental | GPOR | Gulfport Energy Corporation | 55 |
| Top Tech. & Fund. | GPOR | Gulfport Energy Corporation | 55 |
If you received this newsletter from a friend and you would like to receive it regularly please go to the BreakoutWatch.com site and enter as a Guest. You will then be able to register to receive the newsletter.
Copyright © 2011 NBIcharts, LLC dba BreakoutWatch.com.
All rights reserved.
"
BreakoutWatch," the BreakoutWatch.com "eye" logo, and the
slogan "tomorrow's breakouts today" are service marks of NBIcharts
LLC. All other marks are the property of their respective owners, and are
used for descriptive purposes only.
BreakoutWatch is not affiliated with Investor's Business Daily or with Mr. William O'Neil.
Our site, research and analysis is supported entirely by subscription and is free from advertising.