| Market Summary | Weekly Breakout Report | Top Breakout Choices | Top 2nd Chances | New Features | Tip of the Week |
The European situation is worsening as Greece gets closer to defaulting on its sovereign debt. It now seems inevitable that Greece will not be able to stick to its budget-cutting targets and Germany is threatening to withhold further aid unless Greece meets the terms of its austerity package. The likely effects of a Greek default are not well understood but will certainly lead to a further fall in the markets as Financial stocks are hit and in the worst case could lead to Lehman Brothers like situation where overnight repo markets freeze-up.
The European situation certainly contributed to the end-of-week sell-off but it is also possible that news of a "credible threat" to New York and/or Washington unnerved the markets. With the ten-year anniversary of 9/11 falling on Sunday, an attack over the weekend would certainly cause panic selling on Monday so some traders may have limited their exposure, just in case.
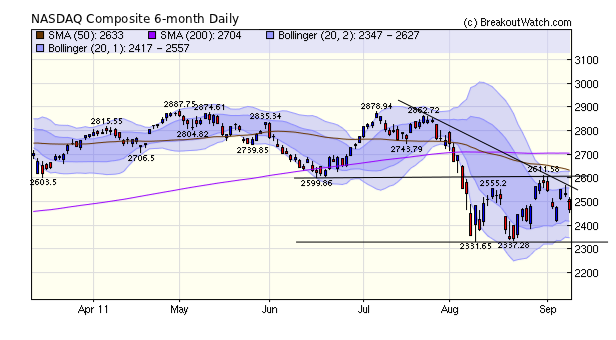
The NASDAQ Composite has fared slightly better than the other major indexes, losing just 0.5% for the week, but the trend is downwards and likely to continue so until support is tested at 2330. A surge above resistance at 2600 would reverse the trend but that seems unlikely until the outcome of a Greek default is known. Adding to the uncertainty is the likelihood that Obama's jobs initiative will be stalled until the debt-commission announces its findings by Thanksgiving.
There were a meager five breakouts this
week compared to fourteen breakdowns. The breakouts could barely manage
a 1% gain for the week while the average gain from breakdowns by Friday
was over 9%.
| Date | Symbol | Base* | B'down Price | Friday Close | Gain % at Friday Close |
|---|---|---|---|---|---|
| 9/9/2011 | COV | SS | 49.71 | 47.72 | 4.20% |
| 9/9/2011 | FXE | FB | 138.23 | 136.09 | 1.60% |
| 9/9/2011 | PQ | HS | 7.39 | 7.28 | 1.50% |
| 9/9/2011 | AUQ | SS | 12.35 | 11.7 | 5.60% |
| 9/9/2011 | NG | SS | 9.51 | 9.16 | 3.80% |
| 9/8/2011 | FXE | FB | 139.02 | 136.09 | 2.20% |
| 9/8/2011 | ELN | HS | 9.93 | 9.59 | 3.50% |
| 9/6/2011 | SFN | HS | 13.26 | 9.59 | 38.30% |
| 9/2/2011 | NWSA | HS | 16.75 | 16.03 | 4.50% |
| 9/2/2011 | SQM | HS | 63.62 | 58.59 | 8.60% |
| 9/2/2011 | PQ | HS | 7.39 | 7.28 | 1.50% |
| 9/2/2011 | HRB | SS | 14.87 | 13.13 | 13.30% |
| 9/1/2011 | VPHM | HS | 19.71 | 18.2 | 8.30% |
| 9/1/2011 | VRUS | HS | 102.57 | 74.39 | 37.90% |
| Average gain at Friday's Close |
9.63% |
||||
| * SS: 50 day breakdown FB: Flat Base HS: Head and Shoulders Top |
|||||
No new features this week.
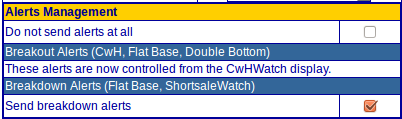
How to Receive Breakdown Alerts
By default, we do not send breakdown alerts as the primary purpose of our site has been to identify potentially profitable long positions and many individually directed investors are uncomfortable with going short.
This article makes the case that We Are in a Secular Bear Market that began 11 years ago. It views the bull market that began in April 2009 as 'cyclical' and that we have now returned to the prevailing bearish trend. It makes the case that with households deleveraging, which will continue until the housing market has bottomed, "we expect U.S. stocks to stay in the secular bear market that started in 2000 for many years to come."
If this is true, and the case for it is very strong, there will be more opportunities to make profits on the short side than on the long, as this weeks comparison of breakout to breakdown performance shows.
Should you wish to receive breakdown alerts then you need to go to menu choice Support > Account Management > Update Account and check the "send Breakdown Alerts" box.
| Index | Value | Change Week | Change YTD | Trend | ||||||||||||||||||||||||||||||||||||
|---|---|---|---|---|---|---|---|---|---|---|---|---|---|---|---|---|---|---|---|---|---|---|---|---|---|---|---|---|---|---|---|---|---|---|---|---|---|---|---|---|
| Dow | 10992.1 | -2.21% | -5.06% | Up | ||||||||||||||||||||||||||||||||||||
| NASDAQ | 2467.99 | -0.5% | -6.97% | Down | ||||||||||||||||||||||||||||||||||||
| S&P 500 | 1154.23 | -1.68% | -8.22% | Down | ||||||||||||||||||||||||||||||||||||
| Russell 2000 | 673.96 | -1.38% | -14% | Down | ||||||||||||||||||||||||||||||||||||
| Wilshire 5000 | 12091.3 | -1.57% | -9.02% | Down | ||||||||||||||||||||||||||||||||||||
1The Market Signal is derived from our proprietary
market model. The market model is described on the site. 2The site also shows industry rankings based on fundamentals, combined technical and fundamentals, and on price alone. The site also shows daily industry movements. |
||||||||||||||||||||||||||||||||||||||||
# of Breakouts |
Period Average1 |
Max. Gain During Period2 |
Gain at Period Close3 |
|
|---|---|---|---|---|
| This Week | 5 | 11.62 | 4.27% | 1% |
| Last Week | 9 | 11.54 | 9% | 4.17% |
| 13 Weeks | 258 | 12.08 | 5.84% |
-9.36% |
2This represents the return if each stock were bought at its breakout price and sold at its intraday high.
3This represents the return if each stock were bought at its breakout price and sold at the most recent close.
Category |
Symbol |
Company Name |
Expected Gain1 |
|---|---|---|---|
| Best Overall | GNMK | GenMark Diagnostics, Inc | 110 |
| Top Technical | RLRN | Renaissance Learning, Inc. | 53 |
| Top Fundamental | SWI | SolarWinds, Inc. | 52 |
| Top Tech. & Fund. | SWI | SolarWinds, Inc. | 52 |
Category |
Symbol |
Company Name |
Expected Gain1 |
|---|---|---|---|
| Best Overall | INSP | InfoSpace, Inc. | 70 |
| Top Technical | MFN | Minefinders Corp. Ltd. (USA) | 70 |
| Top Fundamental | INSP | InfoSpace, Inc. | 70 |
| Top Tech. & Fund. | MFN | Minefinders Corp. Ltd. (USA) | 70 |
If you received this newsletter from a friend and you would like to receive it regularly please go to the BreakoutWatch.com site and enter as a Guest. You will then be able to register to receive the newsletter.
Copyright © 2011 NBIcharts, LLC dba BreakoutWatch.com.
All rights reserved.
"
BreakoutWatch," the BreakoutWatch.com "eye" logo, and the
slogan "tomorrow's breakouts today" are service marks of NBIcharts
LLC. All other marks are the property of their respective owners, and are
used for descriptive purposes only.
BreakoutWatch is not affiliated with Investor's Business Daily or with Mr. William O'Neil.
Our site, research and analysis is supported entirely by subscription and is free from advertising.