| Market Summary | Weekly Breakout Report | Top Breakout Choices | Top 2nd Chances | New Features | Tip of the Week |
The major indexes moved higher this week but reversed on Friday as traders and investors continued to fret over the European sovereign debt issue and Fitch downgraded Spanish and Italian debt. Although a rally took hold in the afternoon, traders took profits in the last hour of trading on Friday not wishing to be exposed to disappointing news that could emerge from a coming meeting on Sunday between Germany's Chancellor Merkel and French President Sarkozy.
The week contained two examples of the success of technical analysis. In last week's newsletter we identified a support level at 2320 and sure enough a bounce came on Monday at that level. On Thursday, we warned of resistance at the 50 day moving average and indeed Friday's reversal came as the index touched its 50 day moving average. The 6-month chart shows that it has retreated from its 50 day average three times since making the head of the head and shoulders pattern we've discussed for the last two weeks. We anticipate that the trend will remain down and that there is a fair to good chance that the index will reach the target we identified last week of just below 2200.
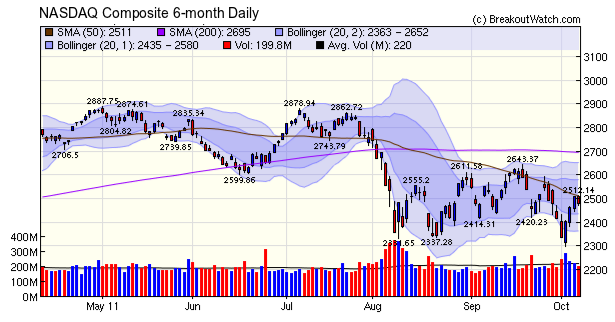
If you think that the support level at 2320 and the retreats from the 50 day average are coincidence and that technical analysis is faux-science, then have a look at this link regarding Monday's bounce. With computer trading becoming all-pervading, these technical levels assume more significance.
Steve Jobs
 Everyone
is praising Steve Jobs and so must I. I've been in the IT industry for
45 years and without doubt he was the most influential person in the
democratization of computing. The Apple II was the first really useful
personal computer and the Macintosh took the gui out of the labs at
PARC and made the computer truly friendly for the first time.
Unfortunately the Mac lost out to the PC in the corporate world because
IT managers bought into the IBM propaganda that 'no IT manager ever got
fired for buying IBM' and preferred the PC to the Mac. Nevertheless,
the gui was adopted by Microsoft but it was not until 1990 that a
useful (but still crippled) version (3.0) appeared. Windows has
now become almost as easy to use as the first Macintosh was, but it
took 20 years. Jobs must get the credit for the vision that made that
possible.
Everyone
is praising Steve Jobs and so must I. I've been in the IT industry for
45 years and without doubt he was the most influential person in the
democratization of computing. The Apple II was the first really useful
personal computer and the Macintosh took the gui out of the labs at
PARC and made the computer truly friendly for the first time.
Unfortunately the Mac lost out to the PC in the corporate world because
IT managers bought into the IBM propaganda that 'no IT manager ever got
fired for buying IBM' and preferred the PC to the Mac. Nevertheless,
the gui was adopted by Microsoft but it was not until 1990 that a
useful (but still crippled) version (3.0) appeared. Windows has
now become almost as easy to use as the first Macintosh was, but it
took 20 years. Jobs must get the credit for the vision that made that
possible.Drawdown is now calculated for both long and short strategies on the Stock Timeliness Checkup tool.
Stock Timeliness Checkup Tool Drawdown Calculation
The maximum drawdown is now calculated when you run either a long or short position. The maximum drawdown is measured from the point where you open a position to the lowest subsequent intra-day low, for long positions, or the highest intraday high for short positions, before the position is closed.
The display now shows the maximum drawdown out of all positions taken over the backtest period, and the date it occurred. Here are the results for going short on BAC:
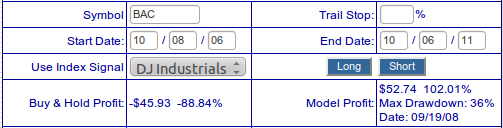
To illustrate how the drawdown is calculated, have a look at this chart. The position was opened on 8/19/08 at $28.96 and not closed, using the DJI trend as a reference, until 2/4/09 at $5.47. However, before the position was closed the price rose to an intra-day high of $39.5 on 9/19/08 giving you a loss, if you closed the position at that price of 36%. That was the maximum drawdown of the 14 positions opened and closed over the backtest period.
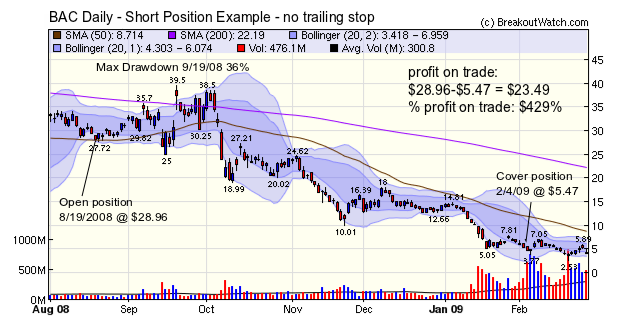
The tool allows you to test trailing stop levels. In the example above, no trailing stop was used, but if a trailing stop of 10% were used on this same trade, then you would have covered on 8/28/08 for a loss of $2.03 or 6.1%.
In the example above, you would have had income of $28.96 when you opened the position and then paid out $5.47 when you closed the position. Your net profit therefore was $23.49 for an outlay of $5.47 - a handsome profit of 429%! You would have had to have great confidence in our trend signals though, and possibly nerves of steel!
Note: none of these calculations allow for broker fees or slippage.
| Index | Value | Change Week | Change YTD | Trend | ||||||||||||||||||||||||||||||||||||
|---|---|---|---|---|---|---|---|---|---|---|---|---|---|---|---|---|---|---|---|---|---|---|---|---|---|---|---|---|---|---|---|---|---|---|---|---|---|---|---|---|
| Dow | 11103.1 | 1.74% | -4.1% | Down | ||||||||||||||||||||||||||||||||||||
| NASDAQ | 2479.35 | 2.65% | -6.54% | Down | ||||||||||||||||||||||||||||||||||||
| S&P 500 | 1155.46 | 2.12% | -8.12% | Up | ||||||||||||||||||||||||||||||||||||
| Russell 2000 | 656.21 | 1.87% | -16.26% | Up | ||||||||||||||||||||||||||||||||||||
| Wilshire 5000 | 12020.5 | 2.11% | -9.55% | Down | ||||||||||||||||||||||||||||||||||||
1The Market Signal is derived from our proprietary
market model. The market model is described on the site. 2The site also shows industry rankings based on fundamentals, combined technical and fundamentals, and on price alone. The site also shows daily industry movements. |
||||||||||||||||||||||||||||||||||||||||
# of Breakouts |
Period Average1 |
Max. Gain During Period2 |
Gain at Period Close3 |
|
|---|---|---|---|---|
| This Week | 10 | 12.08 | 2.82% | -2.03% |
| Last Week | 10 | 12.15 | 4.65% | -1.23% |
| 13 Weeks | 260 | 13.08 | 6.68% |
-11.38% |
2This represents the return if each stock were bought at its breakout price and sold at its intraday high.
3This represents the return if each stock were bought at its breakout price and sold at the most recent close.
Category |
Symbol |
Company Name |
Expected Gain1 |
|---|---|---|---|
| Best Overall | VCBI | Virginia Commerce Bancorp, Inc. | 94 |
| Top Technical | RTSA | iPath Short Extended Russell 2000 TR Index ETN&nbs | 56 |
| Top Fundamental | AAPL | Apple Inc. | 36 |
| Top Tech. & Fund. | AAPL | Apple Inc. | 0 |
Category |
Symbol |
Company Name |
Expected Gain1 |
|---|---|---|---|
| Best Overall | RNOW | RightNow Technologies | 52 |
| Top Technical | RWM | ProShares Short Russell2000(ETF) | 36 |
| Top Fundamental | RNOW | RightNow Technologies | 52 |
| Top Tech. & Fund. | RNOW | RightNow Technologies | 52 |
If you received this newsletter from a friend and you would like to receive it regularly please go to the BreakoutWatch.com site and enter as a Guest. You will then be able to register to receive the newsletter.
Copyright © 2011 NBIcharts, LLC dba BreakoutWatch.com.
All rights reserved.
"
BreakoutWatch," the BreakoutWatch.com "eye" logo, and the
slogan "tomorrow's breakouts today" are service marks of NBIcharts
LLC. All other marks are the property of their respective owners, and are
used for descriptive purposes only.
BreakoutWatch is not affiliated with Investor's Business Daily or with Mr. William O'Neil.
Our site, research and analysis is supported entirely by subscription and is free from advertising.