| Market Summary | Weekly Breakout Report | Top Breakout Choices | Top 2nd Chances | New Features | Tip of the Week |
Only a brief newsletter this week as we are traveling to Lanai this afternoon (Friday) so my son can compete in a triathlon.
In ten years of operating breakoutwatch.com, we have never seen so many confirmed breakouts (88) in one week! This comes after what Bloomberg News descibed as the biggest monthly rally on record.
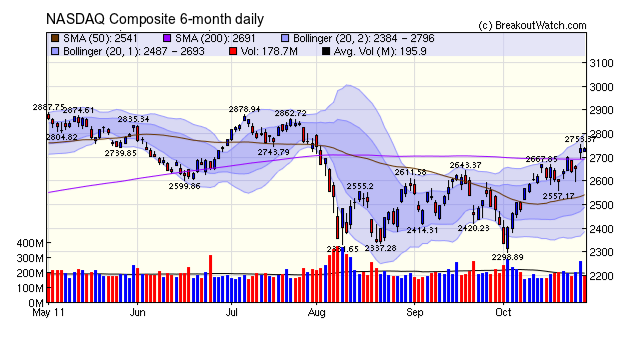
After meeting resistance at the 200 day level earlier in the week, the NASDAQ Composite rose above that level on Thursday and continued to close above it on Friday although there was a slight loss on the day.
The markets surged on Thursday but there are question marks over the reason for the rally. While popular opinion attributes gains to the outcome of the European summit there are real questions over what was actually achieved as we are still waiting for these promises to be backed by actual financial transactions. Certainly the bond markets were not convinced as yields in Spanish and Italian debt rose on Friday. Over at Political Calculations they draw attention to the fact that the markets were rising throughout October despite the European uncertainty and comments at the Big Picture draw attention to the end of October being the end of the fiscal year for many mutual funds. All this leaves us very uncertain about the future direction, while Barry Ritholz thinks we are good for a year end rally:
Year end rally: I have mentioned seasonality several times over the past week, and this rally seems to be running (or perhaps front running) into the best 6 months of the year. This does not mean the secular bear market is over, but it could very well clear us for a few weeks as we “melt up“.
No new features this week.
This feature will return next week.
| Index | Value | Change Week | Change YTD | Trend | ||||||||||||||||||||||||||||||||||||
|---|---|---|---|---|---|---|---|---|---|---|---|---|---|---|---|---|---|---|---|---|---|---|---|---|---|---|---|---|---|---|---|---|---|---|---|---|---|---|---|---|
| Dow | 12231.1 | 3.58% | 5.65% | Down | ||||||||||||||||||||||||||||||||||||
| NASDAQ | 2737.15 | 3.78% | 3.18% | Up | ||||||||||||||||||||||||||||||||||||
| S&P 500 | 1285.08 | 3.78% | 2.18% | Up | ||||||||||||||||||||||||||||||||||||
| Russell 2000 | 761 | 6.82% | -2.89% | Down | ||||||||||||||||||||||||||||||||||||
| Wilshire 5000 | 13454.1 | 4.22% | 1.23% | Down | ||||||||||||||||||||||||||||||||||||
1The Market Signal is derived from our proprietary
market model. The market model is described on the site. 2The site also shows industry rankings based on fundamentals, combined technical and fundamentals, and on price alone. The site also shows daily industry movements. |
||||||||||||||||||||||||||||||||||||||||
# of Breakouts |
Period Average1 |
Max. Gain During Period2 |
Gain at Period Close3 |
|
|---|---|---|---|---|
| This Week | 88 | 15.23 | 5.55% | 2.52% |
| Last Week | 14 | 9.62 | 7.79% | 5.35% |
| 13 Weeks | 277 | 16.46 | 6.75% |
-0.53% |
2This represents the return if each stock were bought at its breakout price and sold at its intraday high.
3This represents the return if each stock were bought at its breakout price and sold at the most recent close.
Category |
Symbol |
Company Name |
Expected Gain1 |
|---|---|---|---|
| Best Overall | SEM | 104 | |
| Top Technical | SGEN | Seattle Genetics, Inc. | 66 |
| Top Fundamental | GNC | GNC Holdings Inc | 68 |
| Top Tech. & Fund. | TRCR | Transcend Services, Inc. | 0 |
Category |
Symbol |
Company Name |
Expected Gain1 |
|---|---|---|---|
| Best Overall | KOG | Kodiak Oil & Gas Corp | 126 |
| Top Technical | HSTM | HealthStream, Inc. | 79 |
| Top Fundamental | HEI | 45 | |
| Top Tech. & Fund. | RRTS | Roadrunner Transportation Systems Inc | 59 |
If you received this newsletter from a friend and you would like to receive it regularly please go to the BreakoutWatch.com site and enter as a Guest. You will then be able to register to receive the newsletter.
Copyright © 2011 NBIcharts, LLC dba BreakoutWatch.com.
All rights reserved.
"
BreakoutWatch," the BreakoutWatch.com "eye" logo, and the
slogan "tomorrow's breakouts today" are service marks of NBIcharts
LLC. All other marks are the property of their respective owners, and are
used for descriptive purposes only.
BreakoutWatch is not affiliated with Investor's Business Daily or with Mr. William O'Neil.
Our site, research and analysis is supported entirely by subscription and is free from advertising.