| Market Summary | Weekly Breakout Report | Top Breakout Choices | Top 2nd Chances | New Features | Tip of the Week |
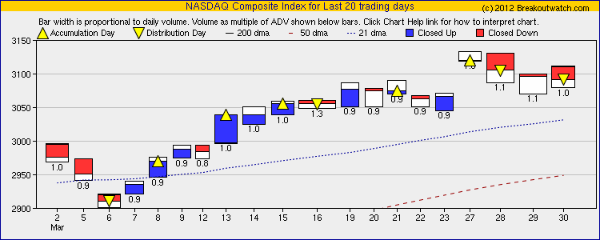
The NASDAQ Composite set a new 10 year high on Monday after Fed Chairman Bernanke promised continued low interest rates but has been in retreat since as concerns over the unresolved European sovereign debt crisis re-emerged. Our equivolume chart shows how downward momentum (price x volume) increased this week.
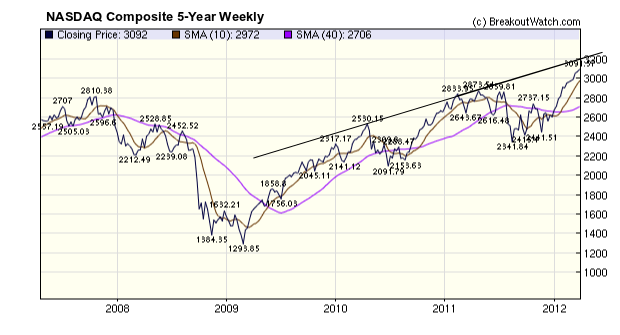
However, this may only be the consolidation we have been expecting after the NASDAQ's stellar Q1 performance. The five year chart shows that we may see 3200 before a real correction begins. Whether or not we get to that level will depend on continued economic and job-market expansion despite escalating energy costs and the threat of war with Iran.
No new features this week.
New Service - Strategy Backtesting
Do you have a strategy in mind that you think will be profitable but don't have the tools or time to evaluate it?
If so, I have an offer for you. Tell me about it and I will evaluate it for you. If it appears profitable, I will then build a custom screen that alerts you when to apply your strategy.
This service is free to Gold and Platinum subscribers. If you are not yet a Gold or Platinum subscriber then tell me about your strategy anyway and if it interests me, perhaps I'll do it for you anyway.
For example, a subscriber asked me to run a screen each week looking for stocks where the 20 week weighted moving average crossed the 50 week weighted moving average. He now gets a report each week of stocks meeting those criteria with links to their chart and CANTATA evaluation.
Below is an example of this weeks report. The 'Up' stocks are potential long candidates and the 'Down' stocks are potential short candidates.
Let me know what I can do for you - its free!
Up and Down Crossovers as of 03/30/12
| Index | Value | Change Week | Change YTD | Trend | ||||||||||||||||||||||||||||||||||||
|---|---|---|---|---|---|---|---|---|---|---|---|---|---|---|---|---|---|---|---|---|---|---|---|---|---|---|---|---|---|---|---|---|---|---|---|---|---|---|---|---|
| Dow | 13212 | 1% | 8.14% | Down | ||||||||||||||||||||||||||||||||||||
| NASDAQ | 3091.57 | 0.77% | 18.67% | Up | ||||||||||||||||||||||||||||||||||||
| S&P 500 | 1408.47 | 0.81% | 12% | Down | ||||||||||||||||||||||||||||||||||||
| Russell 2000 | 830.3 | 1.67% | 12.06% | Down | ||||||||||||||||||||||||||||||||||||
1The Market Signal is derived from our proprietary
market model. The market model is described on the site. 2The site also shows industry rankings based on fundamentals, combined technical and fundamentals, and on price alone. The site also shows daily industry movements. |
||||||||||||||||||||||||||||||||||||||||
# of Breakouts |
Period Average1 |
Max. Gain During Period2 |
Gain at Period Close3 |
|
|---|---|---|---|---|
| This Week | 15 | 26.62 | 3.75% | 0.17% |
| Last Week | 5 | 25.77 | 8.92% | 4.3% |
| 13 Weeks | 264 | 26.92 | 11.87% |
4.74% |
2This represents the return if each stock were bought at its breakout price and sold at its intraday high.
3This represents the return if each stock were bought at its breakout price and sold at the most recent close.
Category |
Symbol |
Company Name |
Expected Gain1 |
|---|---|---|---|
| Best Overall | SCLN | SciClone Pharmaceuticals, Inc. | 117 |
| Top Technical | SCLN | SciClone Pharmaceuticals, Inc. | 117 |
| Top Fundamental | FTK | Flotek Industries, Inc. | 81 |
| Top Tech. & Fund. | FTK | Flotek Industries, Inc. | 81 |
Category |
Symbol |
Company Name |
Expected Gain1 |
|---|---|---|---|
| Best Overall | CNO | CNO Financial Group, Inc. | 87 |
| Top Technical | GMAN | Gordmans Stores, Inc. | 63 |
| Top Fundamental | GMAN | Gordmans Stores, Inc. | 63 |
| Top Tech. & Fund. | GMAN | Gordmans Stores, Inc. | 63 |
If you received this newsletter from a friend and you would like to receive it regularly please go to the BreakoutWatch.com site and enter as a Guest. You will then be able to register to receive the newsletter.
Copyright © 2012 NBIcharts, LLC dba BreakoutWatch.com.
All rights reserved.
"
BreakoutWatch," the BreakoutWatch.com "eye" logo, and the
slogan "tomorrow's breakouts today" are service marks of NBIcharts
LLC. All other marks are the property of their respective owners, and are
used for descriptive purposes only.
BreakoutWatch is not affiliated with Investor's Business Daily or with Mr. William O'Neil.
Our site, research and analysis is supported entirely by subscription and is free from advertising.